PyTorch_Practice_1
1 OverView
Goal of this tutorial
- How to implement learning system using PyTorch
- Understand the basic of neural networks deep learning
Requirements
- Algebra Probability
- Python
Human Intelligence
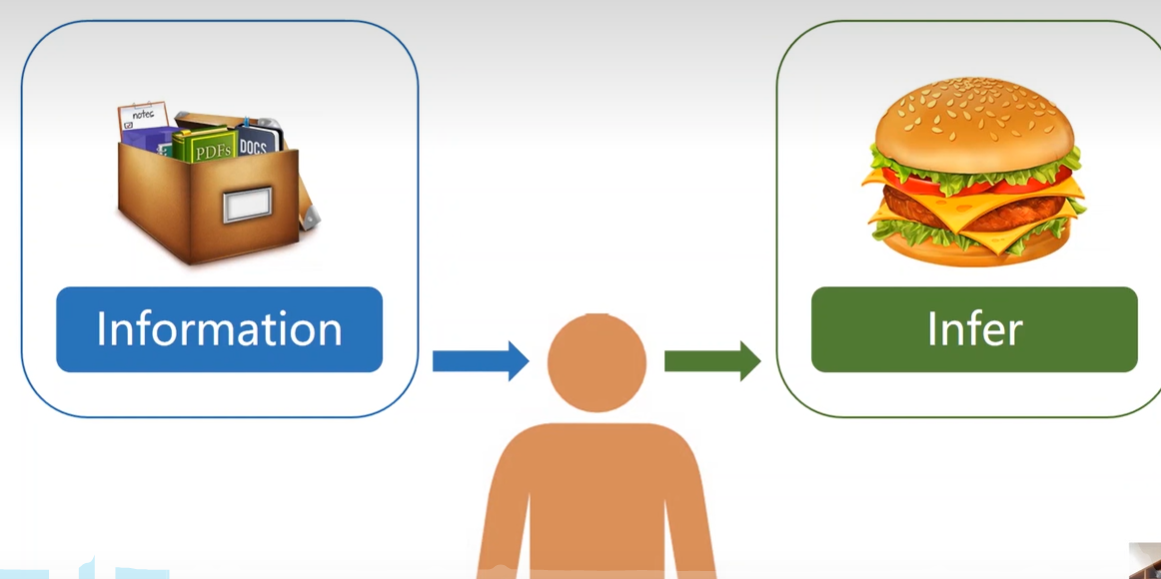
Infer 推理
What to eat for dinner? 决策。根据已有信息(经济,个人偏好)推理。
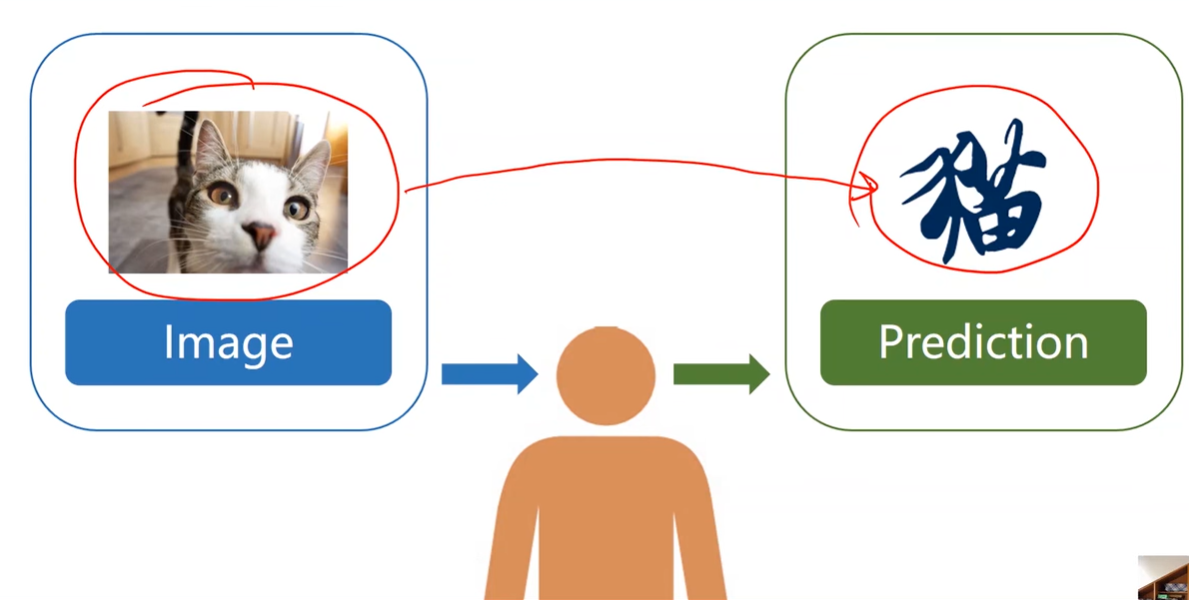
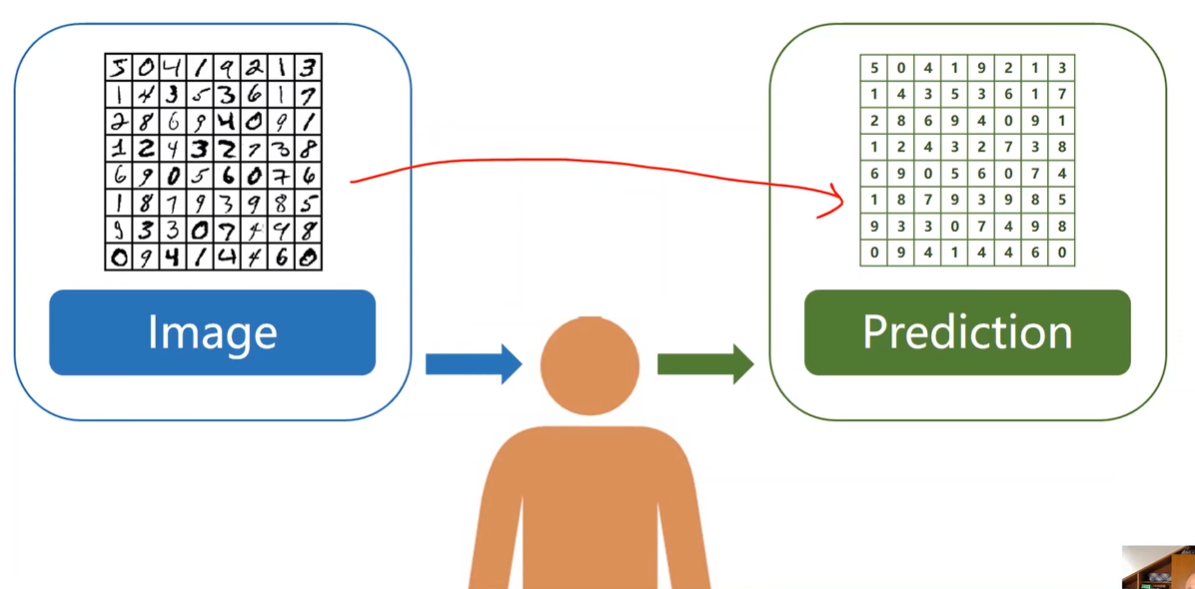
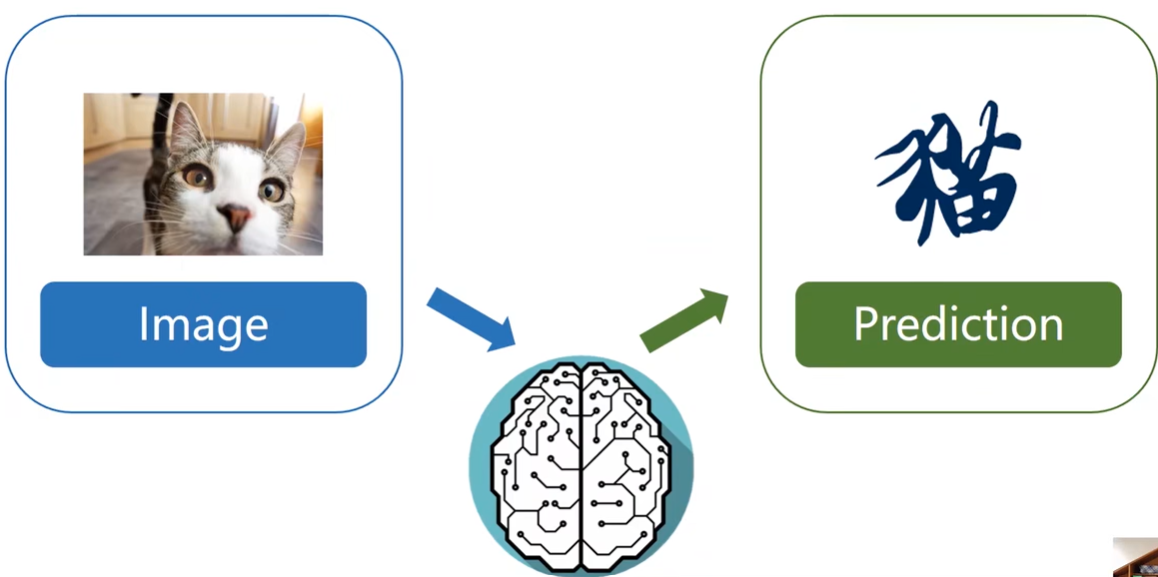
Prediction 预测
实体 -> 抽象
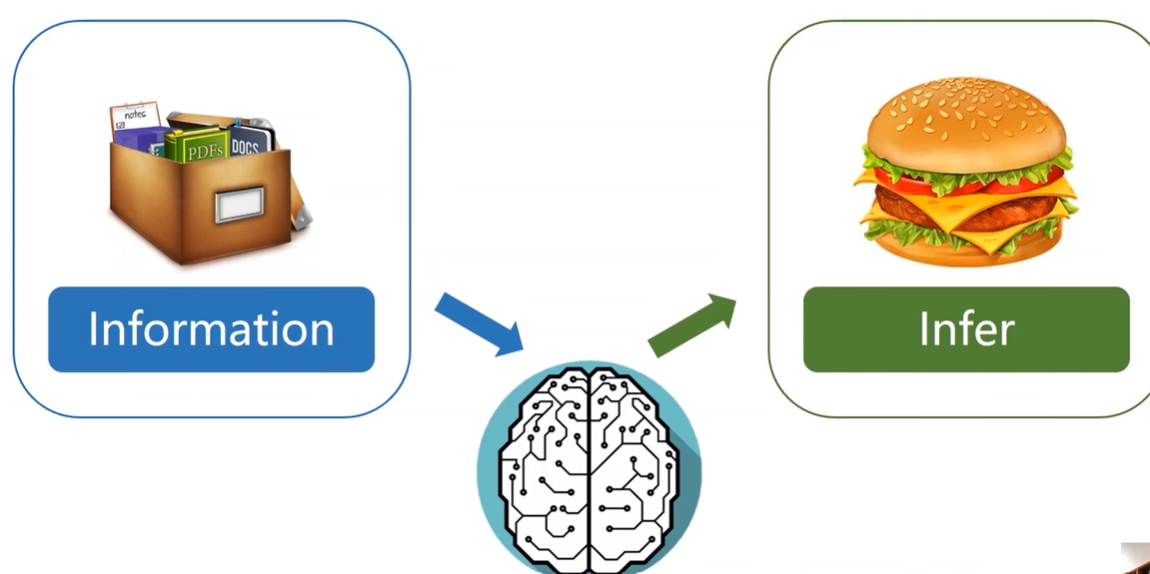
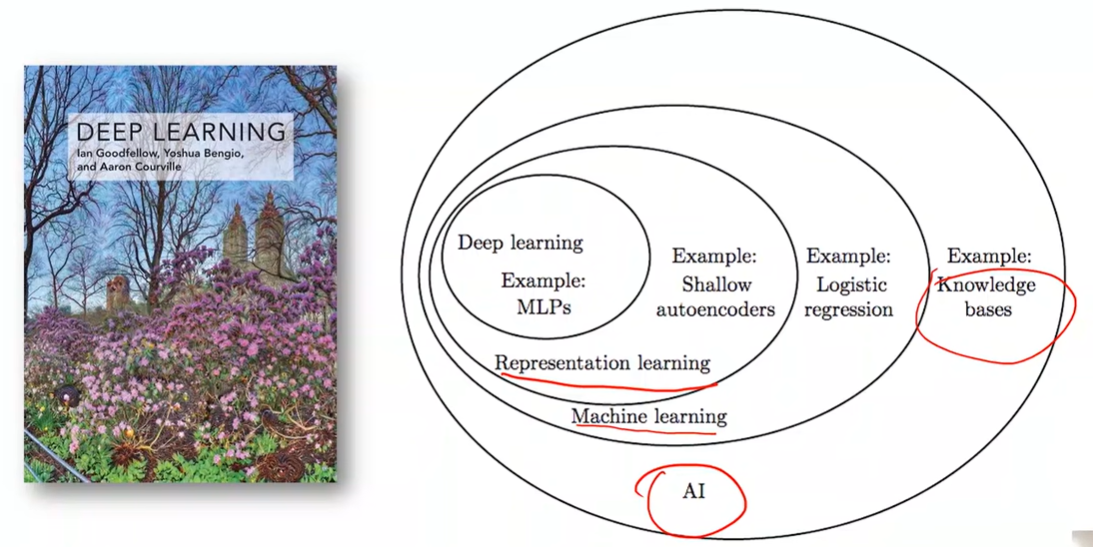
Machine Learning
使用算法推理或预测
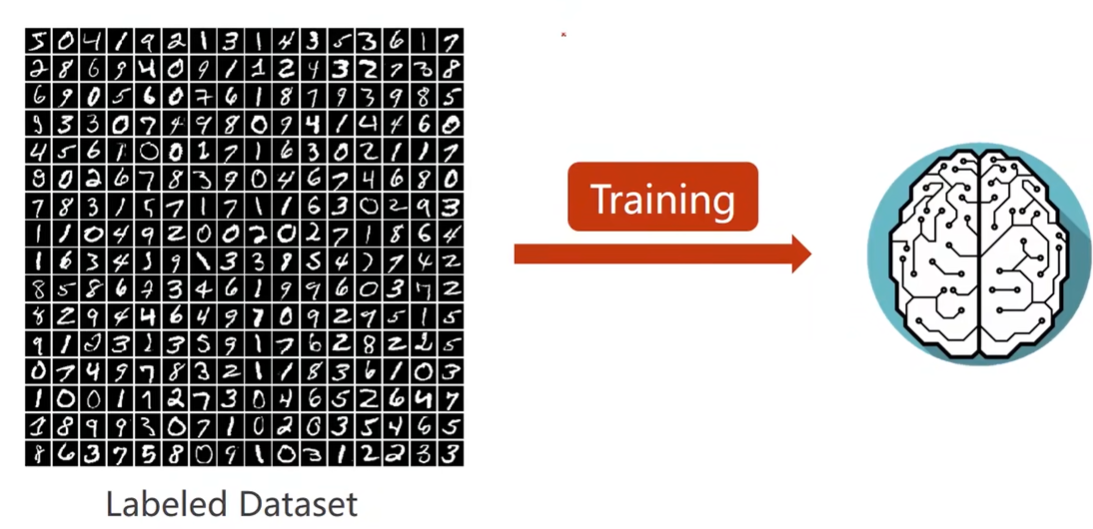
监督学习
使用标签数据集训练模型
常规算法:
- 穷举法
- 贪心法
- 分治法
- 动态规划
机器学习的算法:
利用数据集找出算法
Deep Learning
MLP 多层感知机
How to develop learning system?
基于规则的系统
手工设计程序,规则会越来越多,不利于维护

示例:求原函数
- 构造知识库(函数的原函数)
- 定义规则
- 三角变换
经典机器学习
手工进行特征提取:将输入变为向量。
建立向量和输出的映射:y=f(x)

表示学习

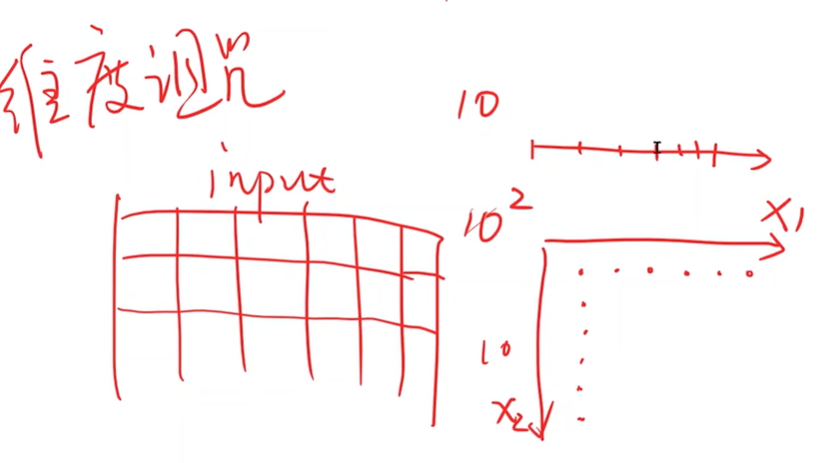
维度诅咒:输入的特征数越多,即维度越高,需要采样的数量越多。
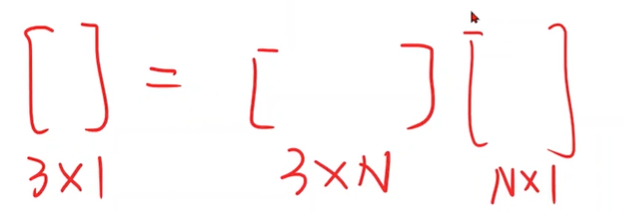
线性映射:N维映射到3维
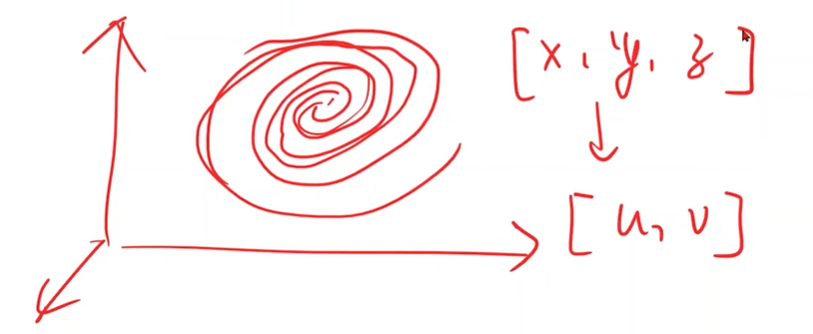
Manifold 流形
示例:银河系
三维映射到二维
深度学习
特征更简单。需要额外的层提取特征

Rule-based system VS Representation Learning

Traditional machine learning strategy
分类,聚类,回归,降维

New challenge
- Limit of hand-designed feature. 人工设计的特征限制
- SVM can not handle big data set well. 大数据
- More and more application need to handle unstructured data. 无结构数据(图像,文本,声音)

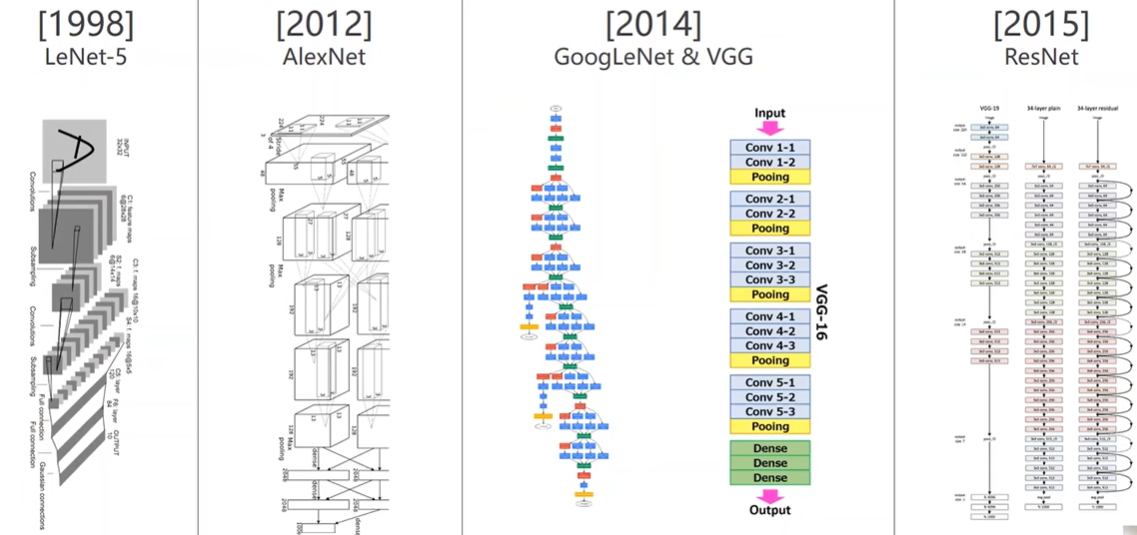
Brief history of neural networks
From neuroscience to mathematic & engineering
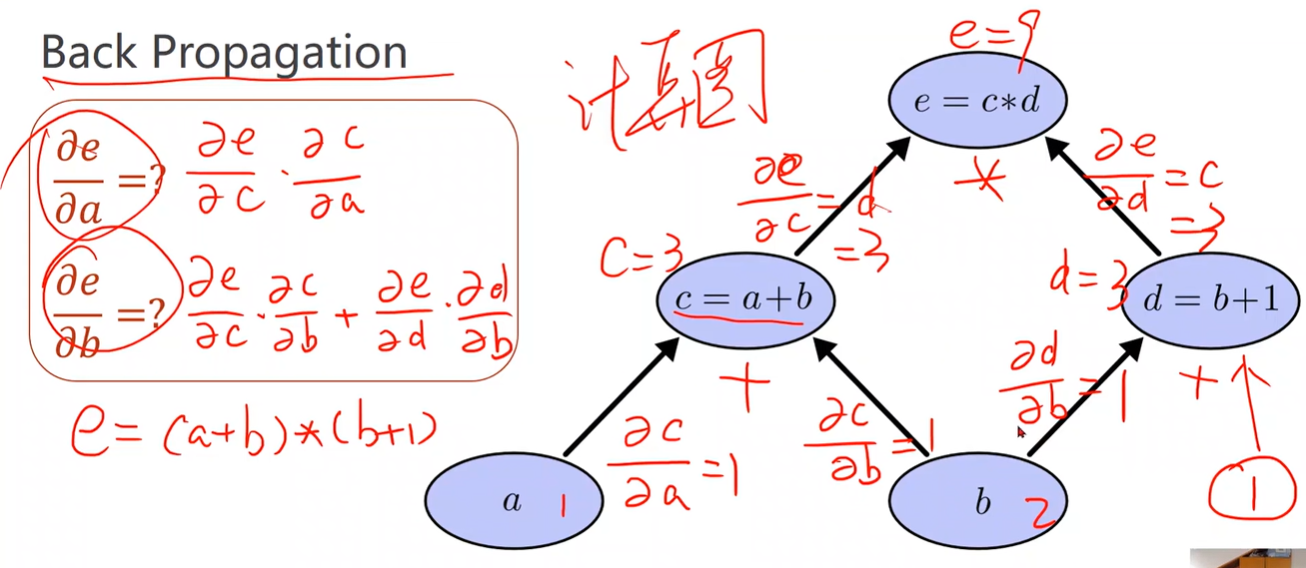
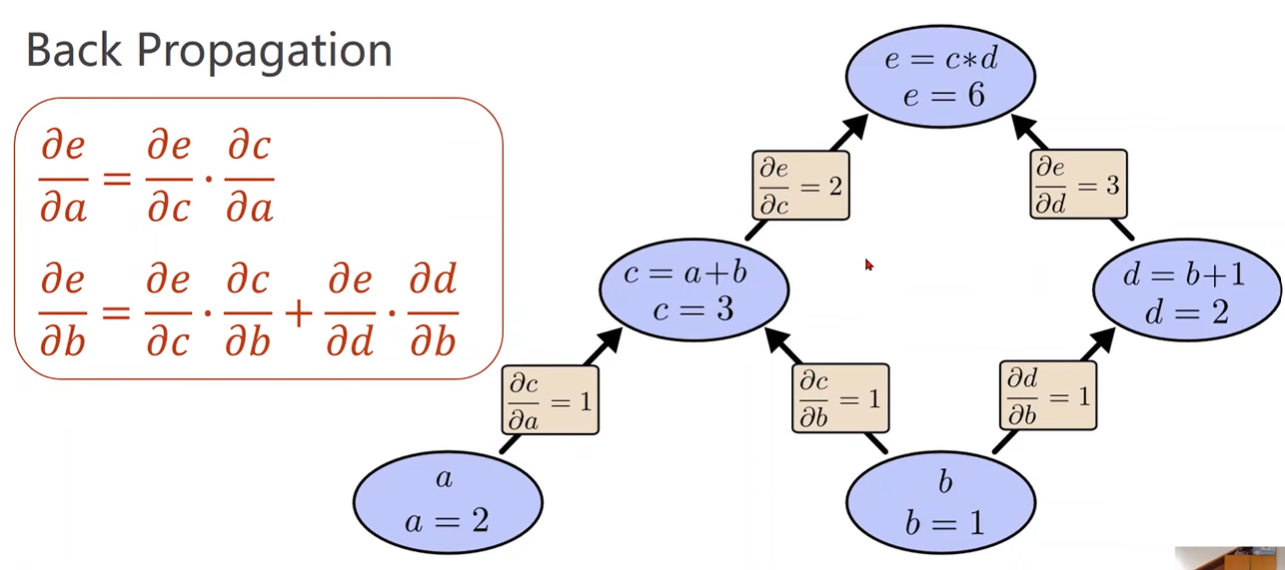
Back Propagation 反向传播
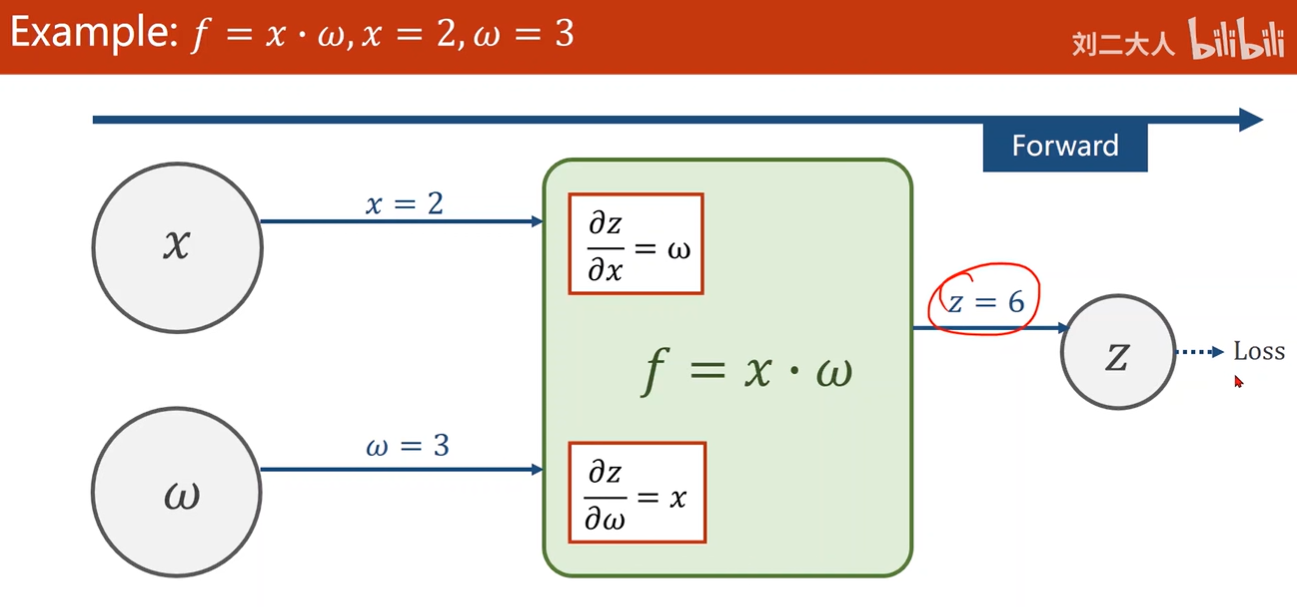
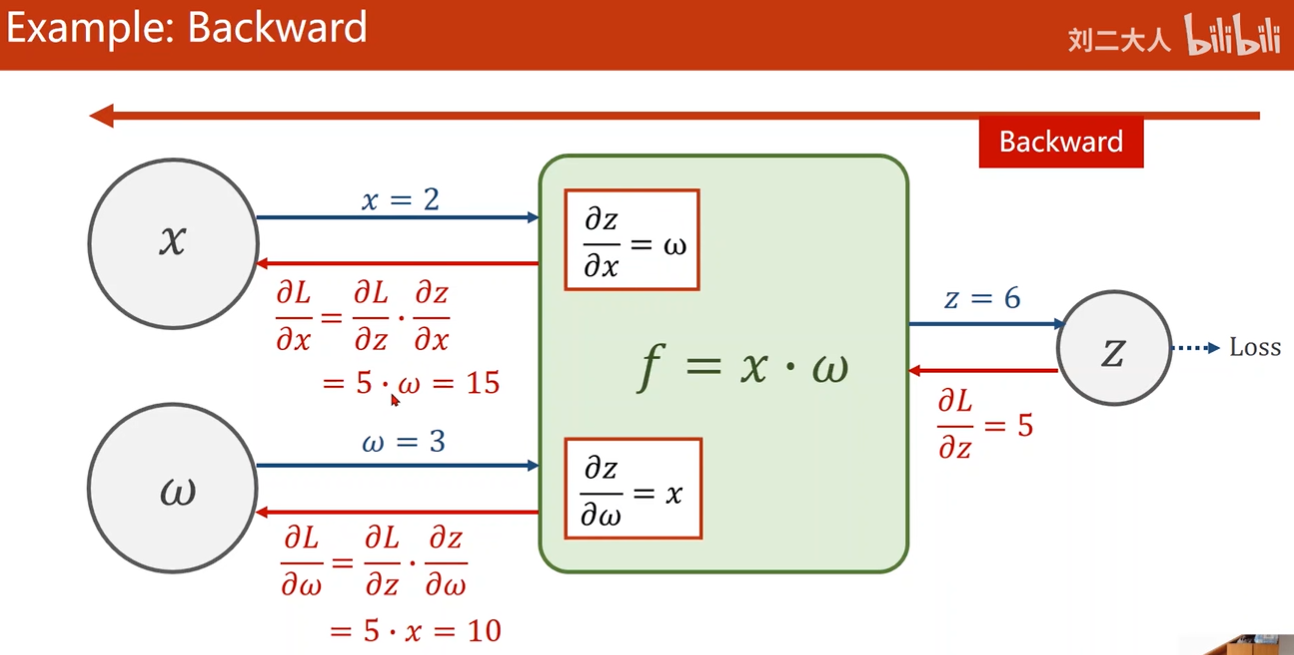
- 计算图可以传播导数
- 链式法则求偏导
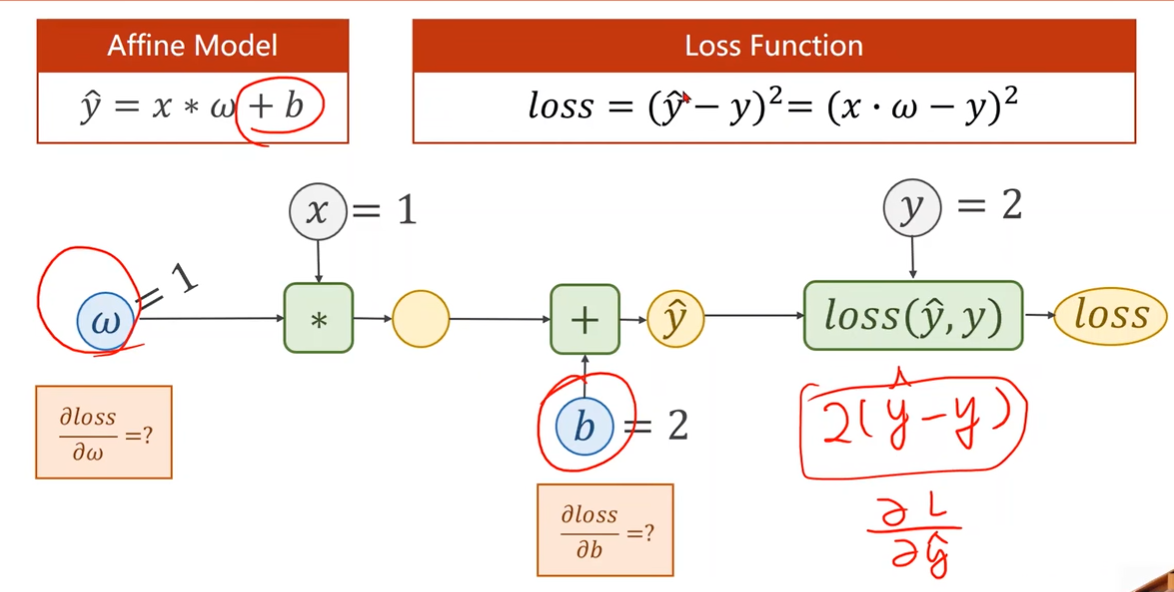
- b的导数需要把所有路径的偏导数相加
2 Linear Model
Machine Learning
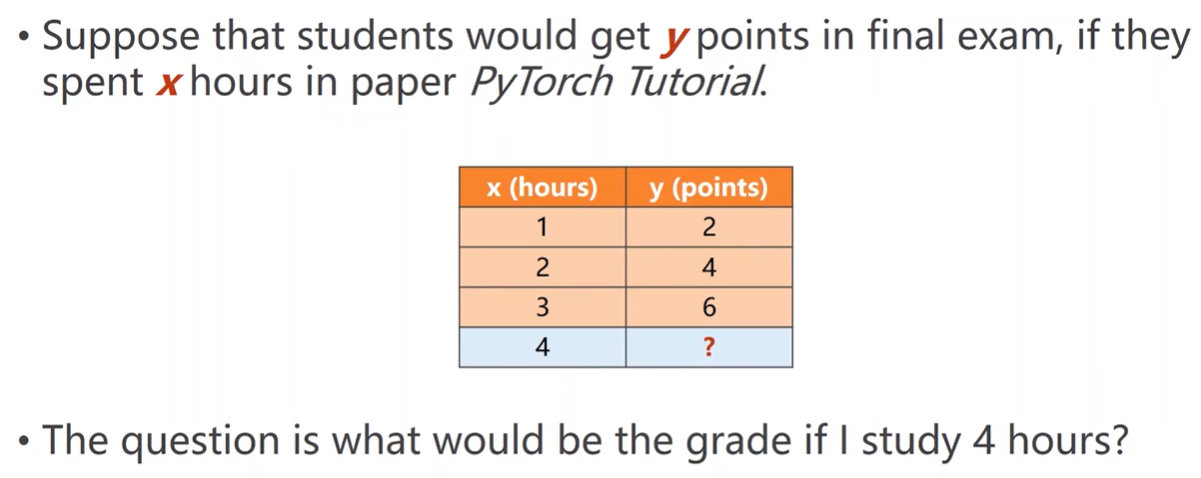
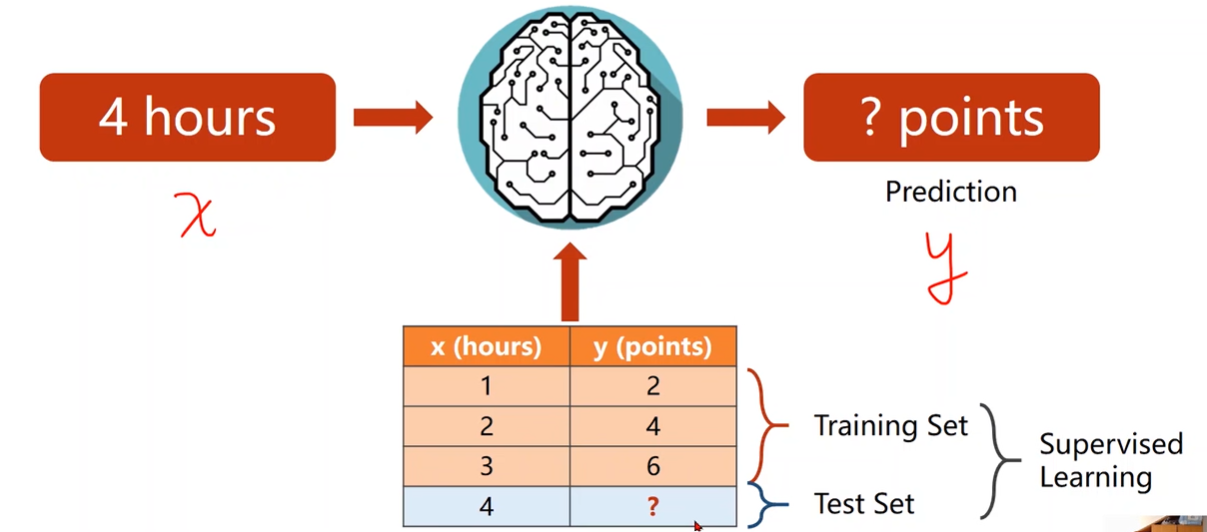
Supervised Learning
训练时知道x和y
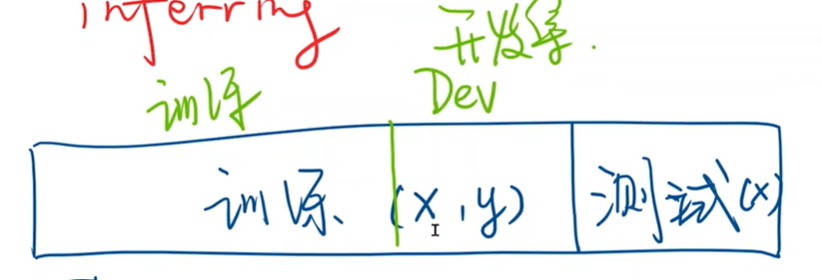
过拟合:训练时误差很小,背景和噪声也学到了(不希望)。
泛化:对于没见过的图像也能正确识别
数据集划分
Model design
What would be the best model for the data?
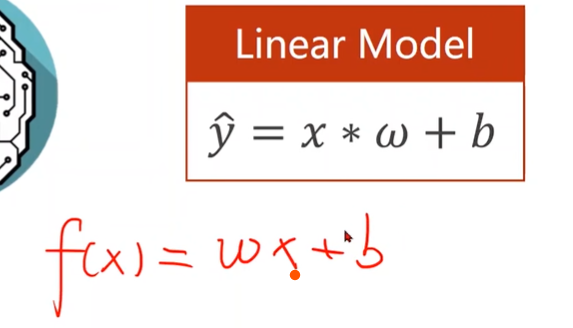
Linear model?
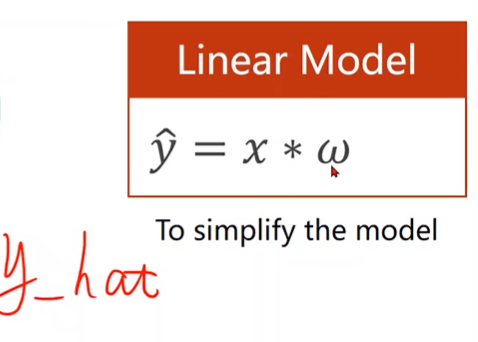
To simplify the model
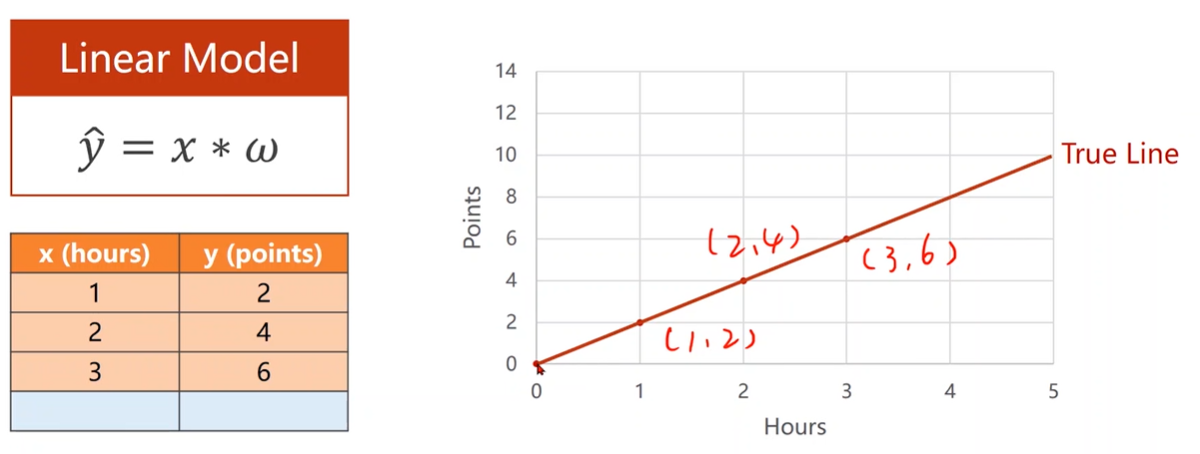
Linear Regression
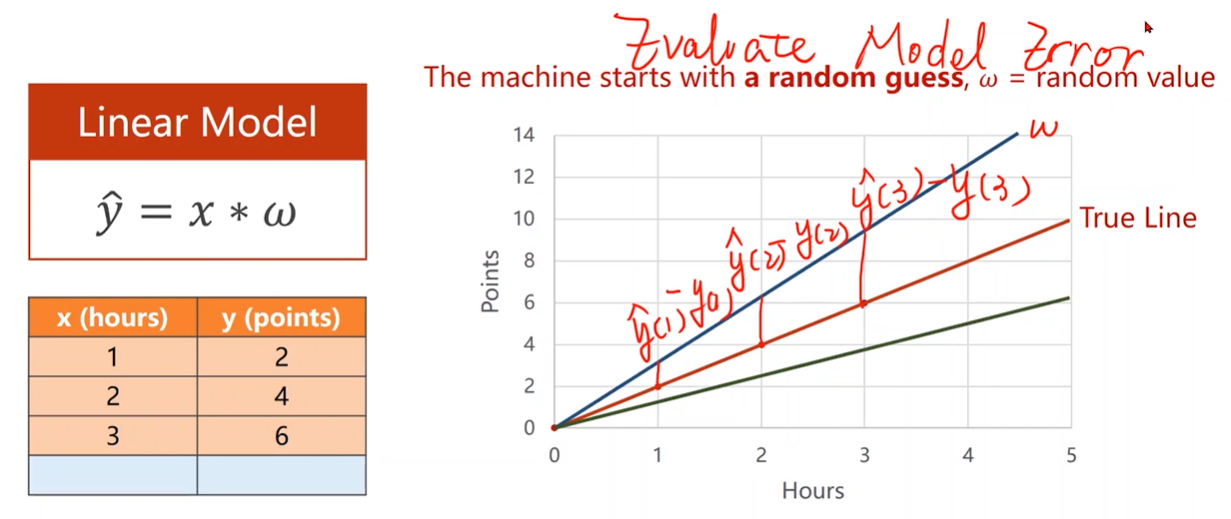
Compute Loss
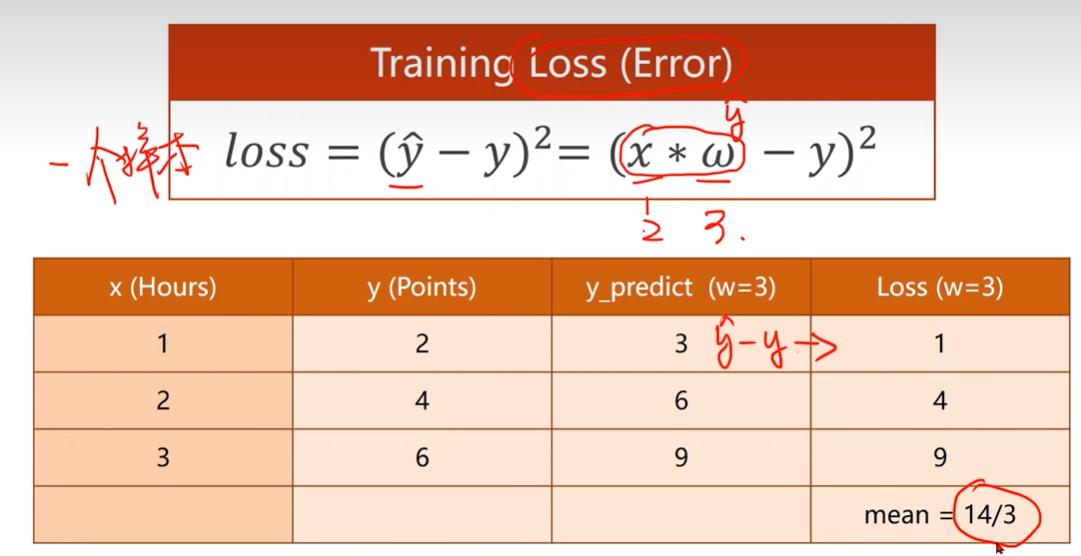
Loss function & Cost function
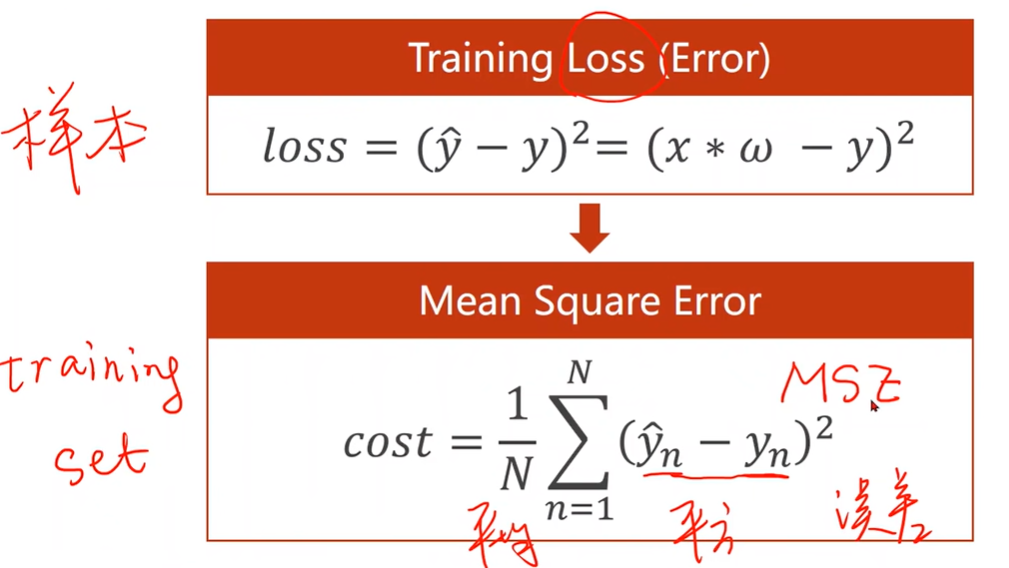
Compute Cost
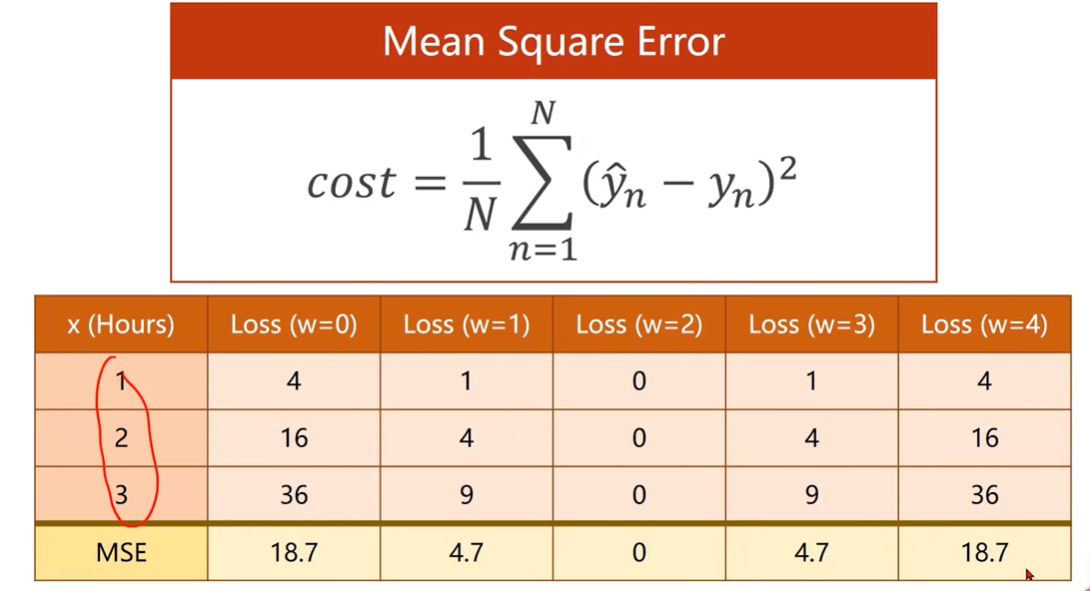
穷举找到最好的权重
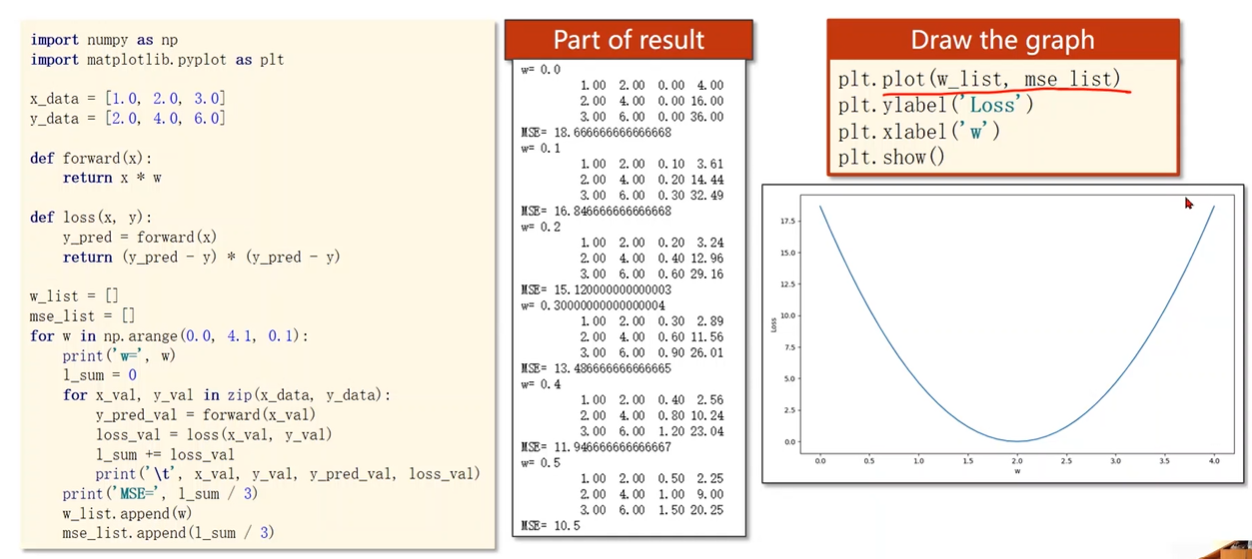
穷举w求出损失函数曲线,找到最低点
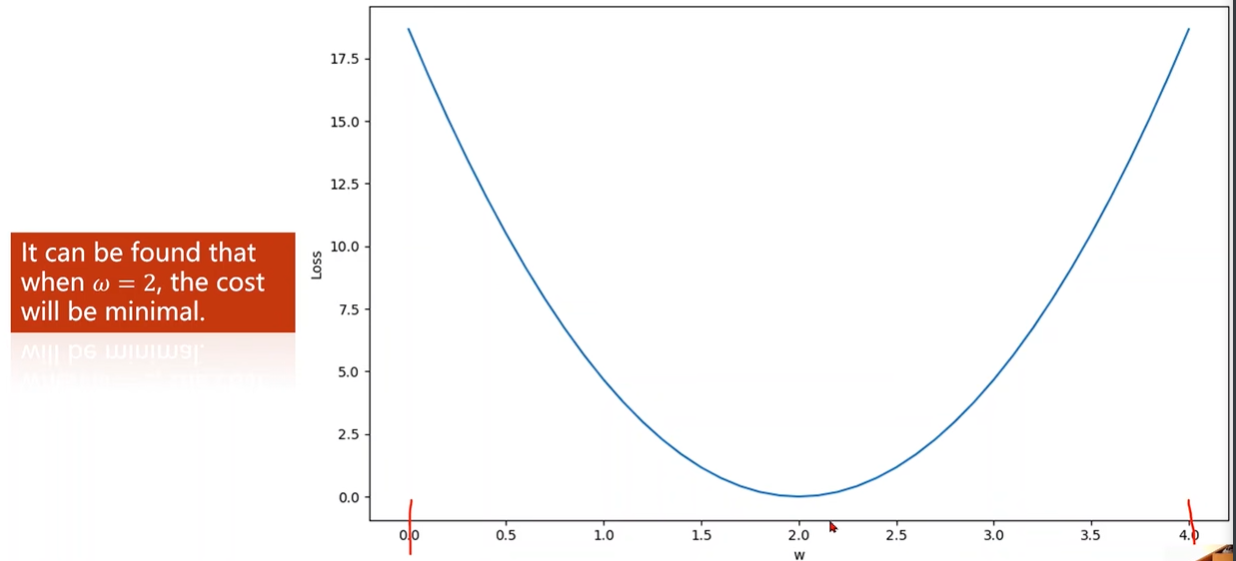
How to draw the graph

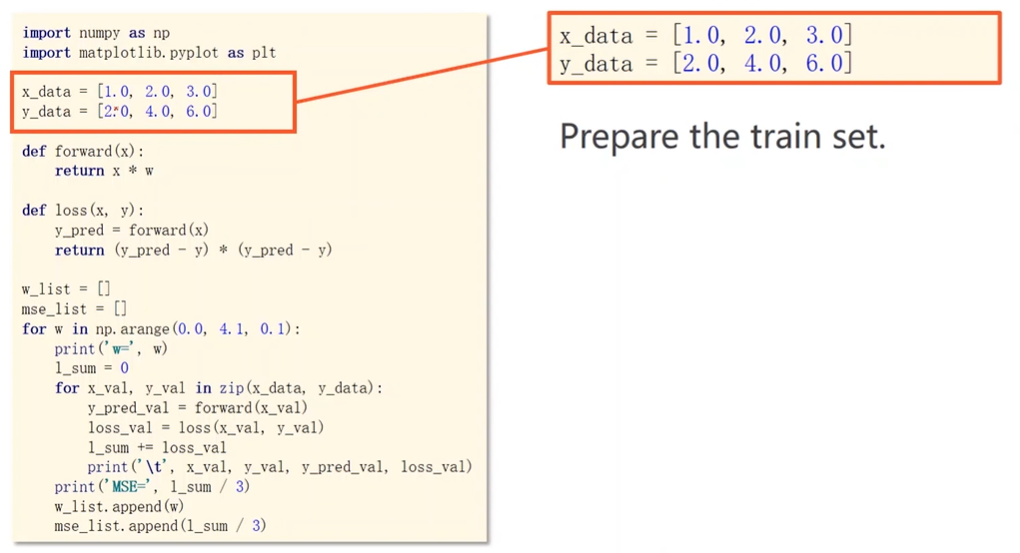
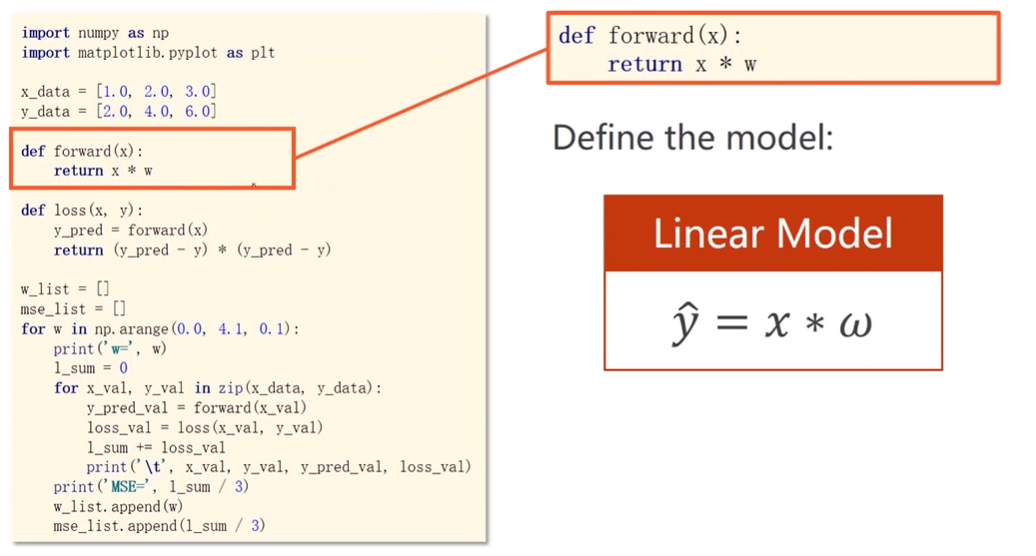

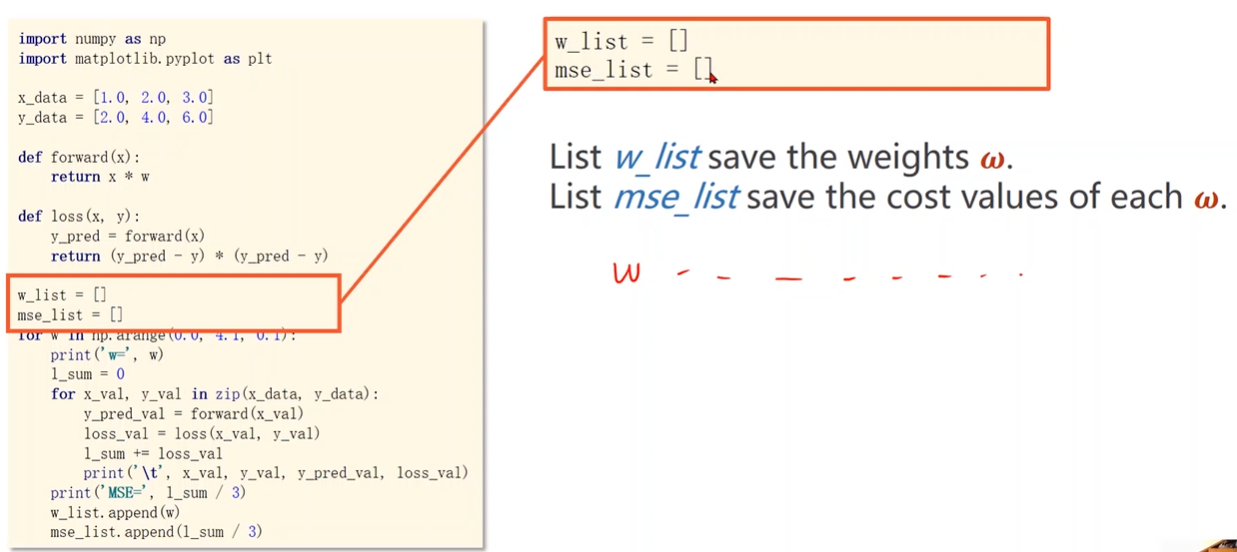
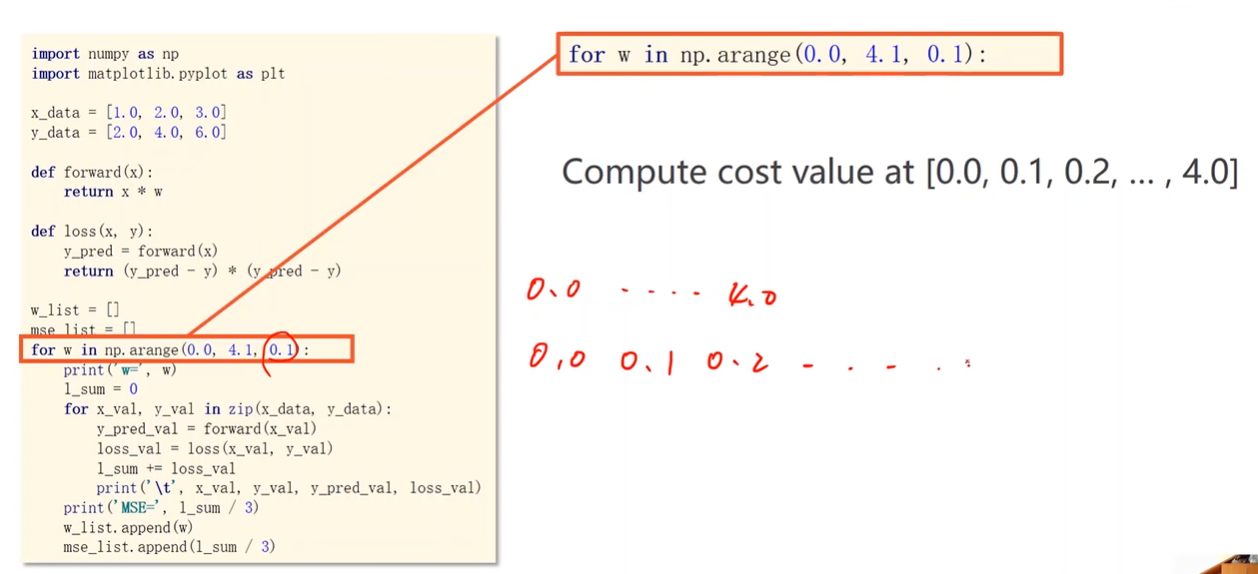
此处没有求均值,只是求和
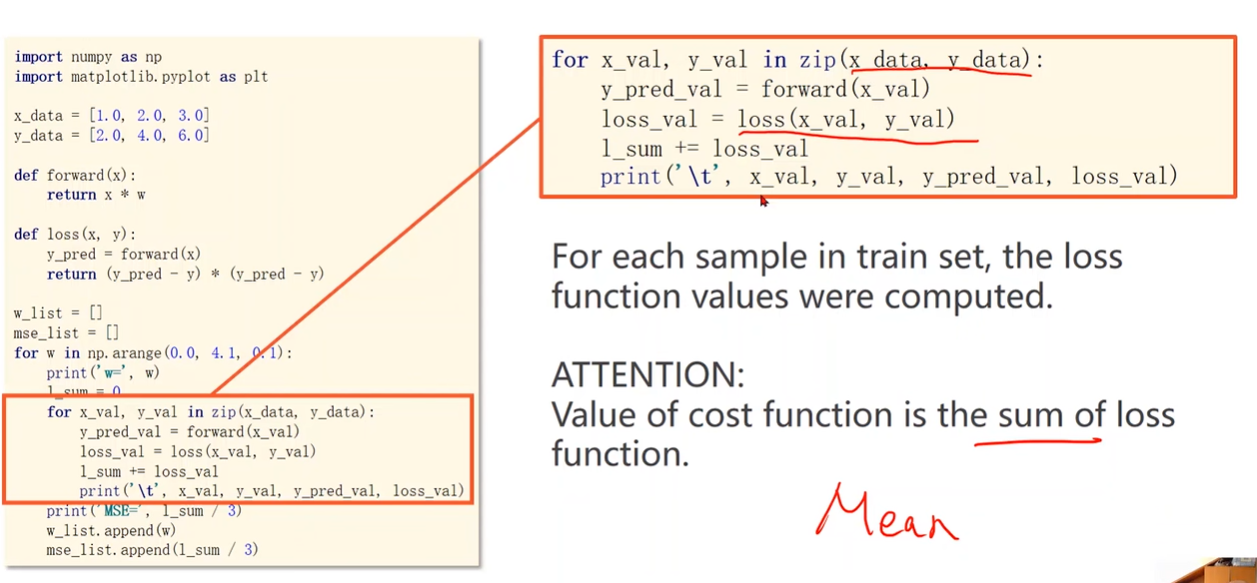
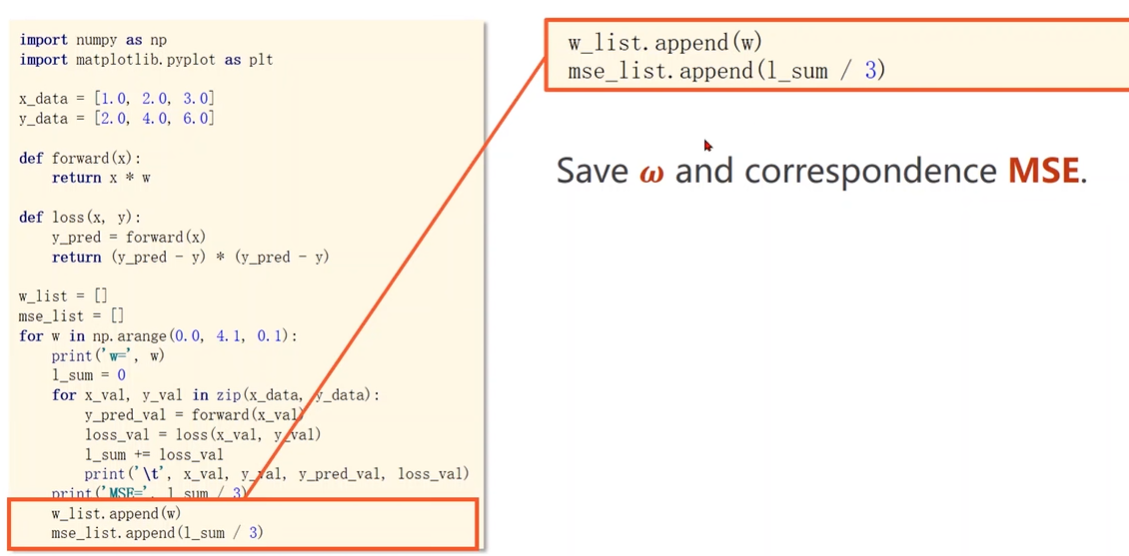
求均值得到MSE
3 Gradient Descent
分治思想
先进行稀疏的搜索,先找16个点
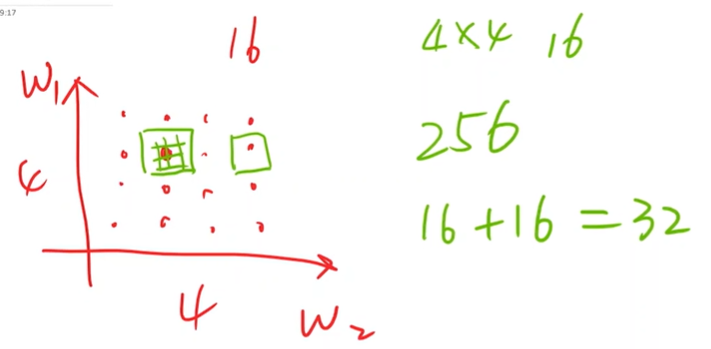
也不行,因为实际cost function函数可能有多个局部最小值

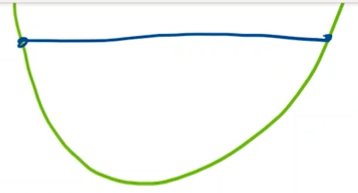
凸函数:连接任意两点,线段上的点都在定义域内的函数上方。
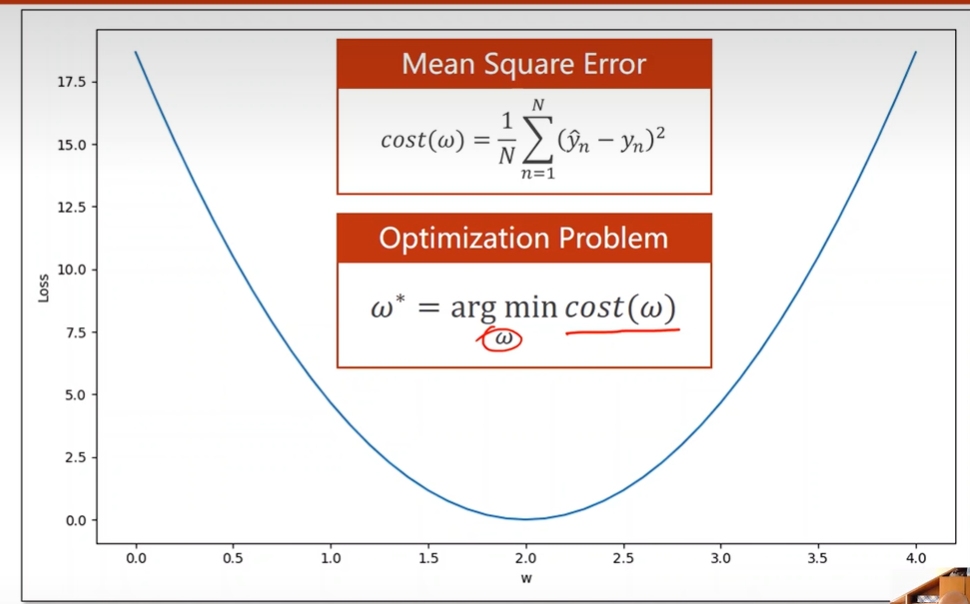
Optimization Problem
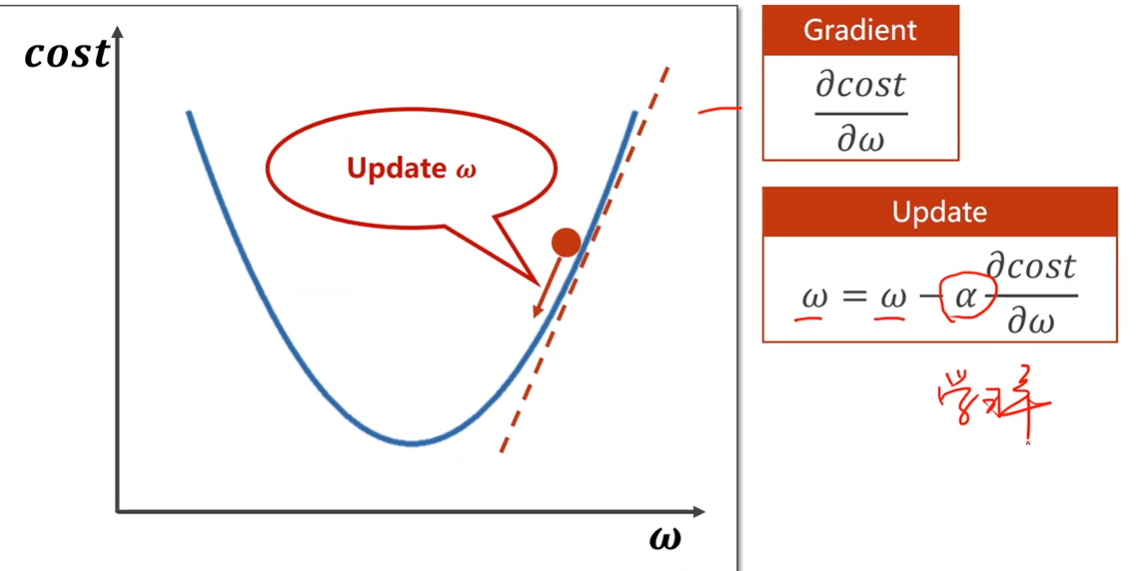
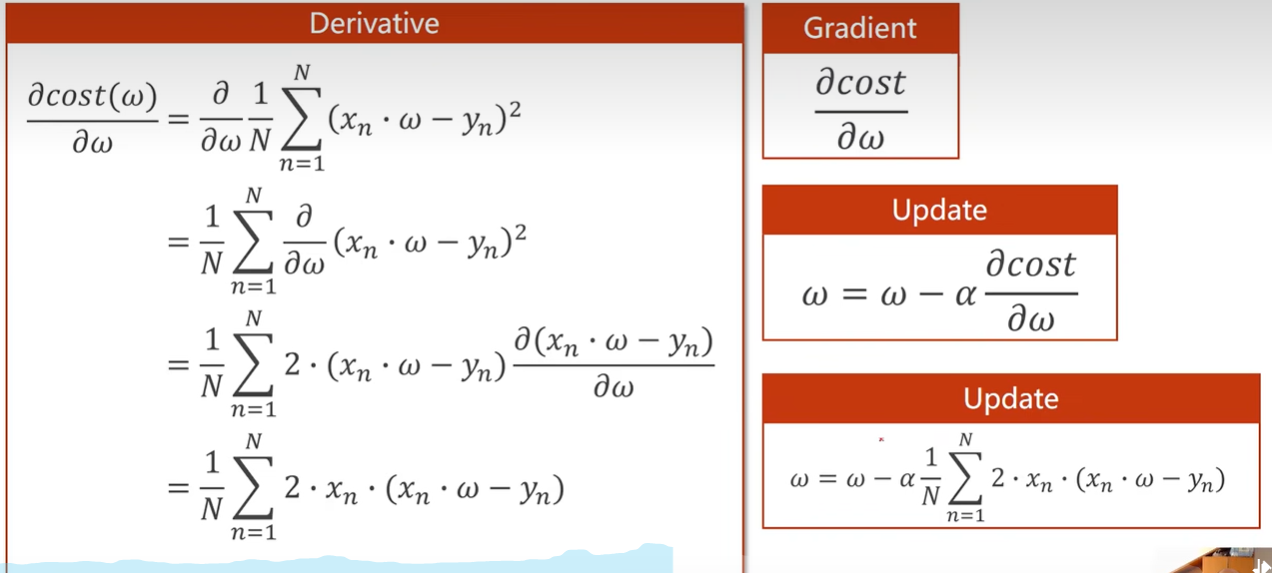
Gradient Descent Algorithm
贪心思想
更新时梯度取反
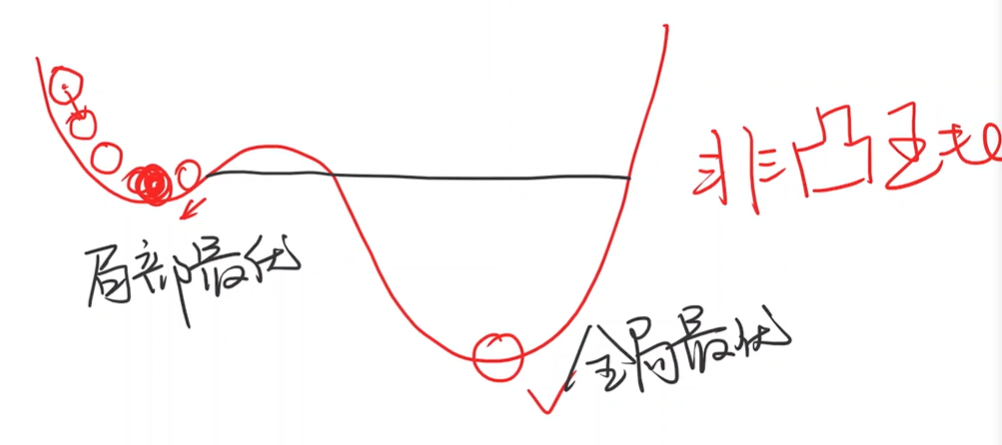
非凸函数
任意两点划一条线,不能保证线段上的点都在对应定义域的函数上方。
使用梯度下降算法只能保证找到局部最优点,不能保证找到全局最优点
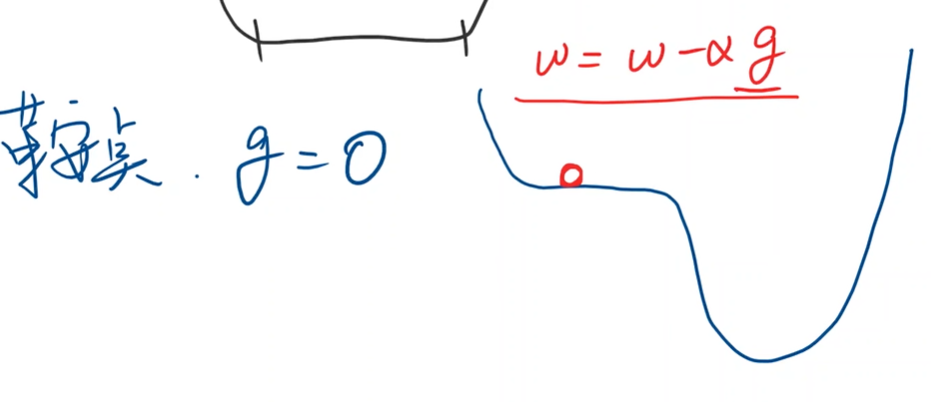
鞍点
梯度等于0,到达鞍点参数更新后还是原值。
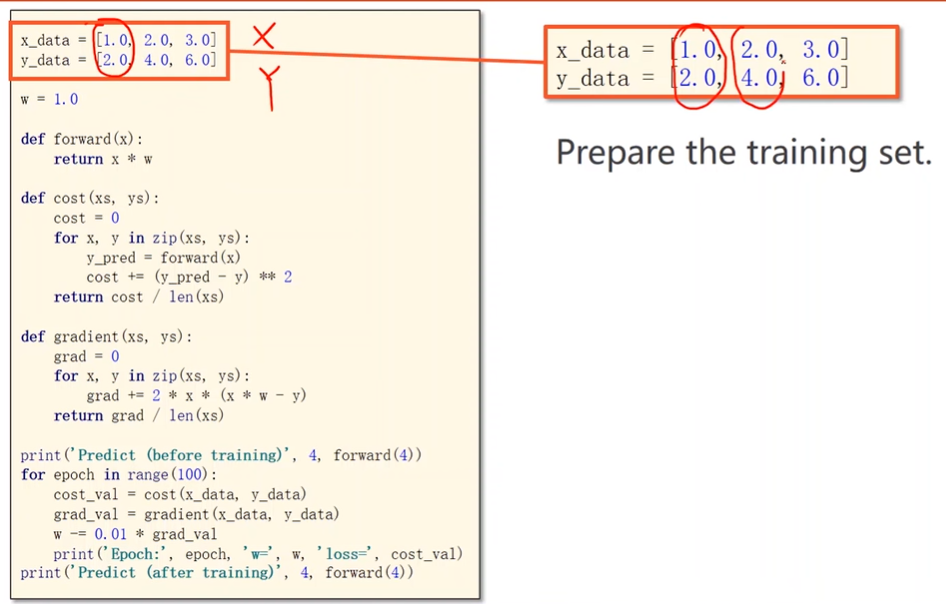
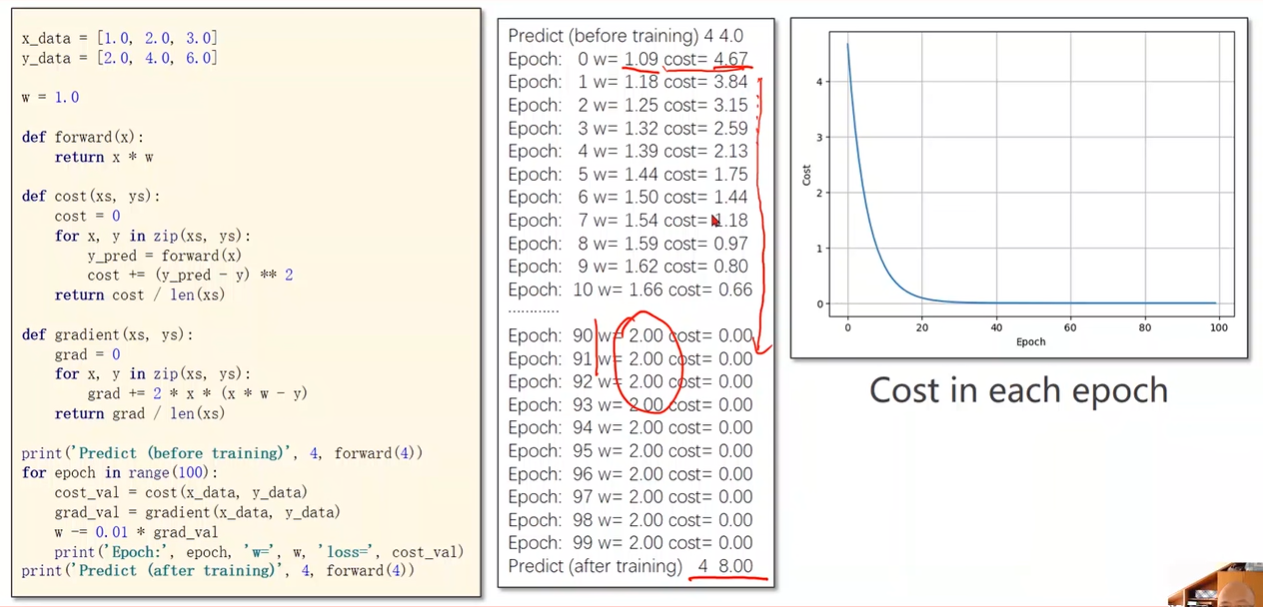
Implementation
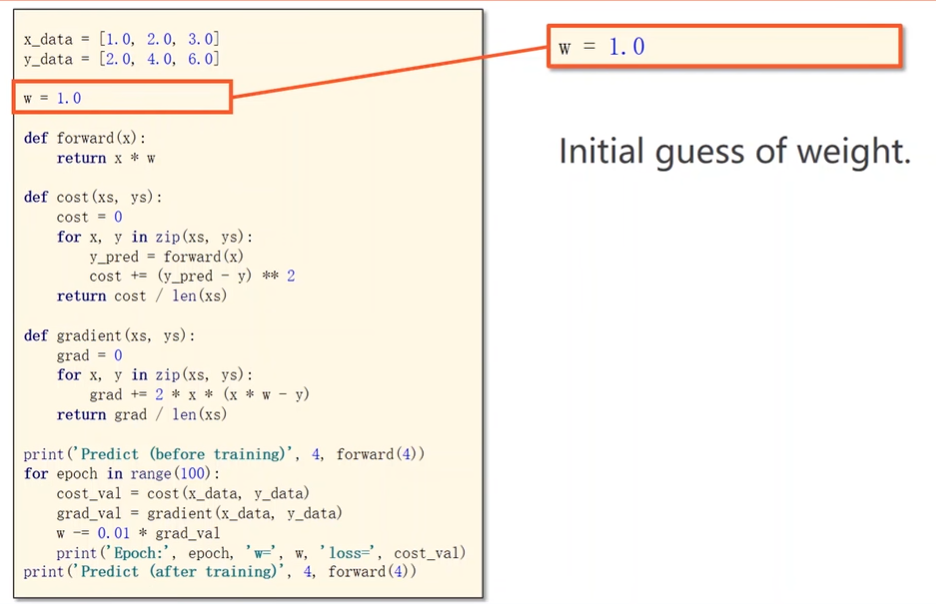
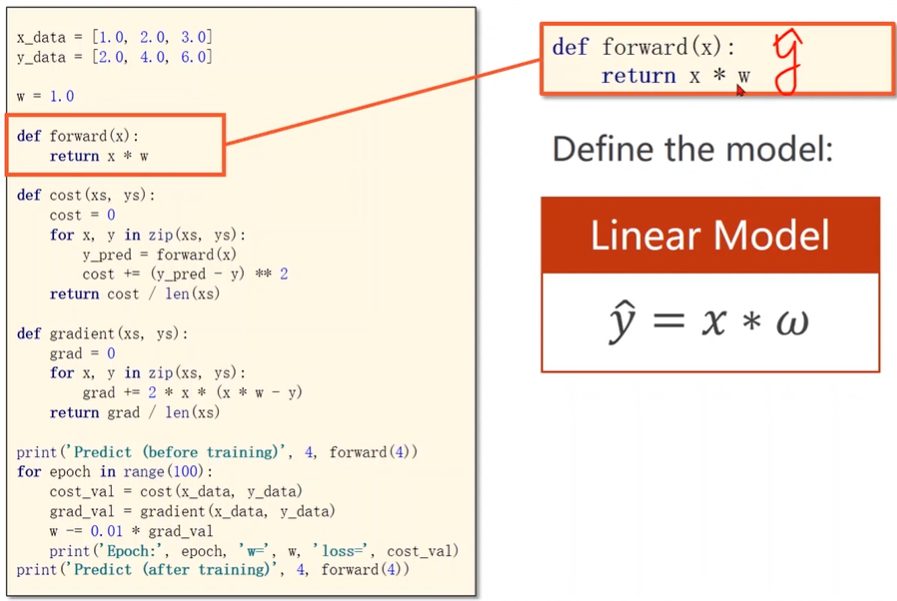
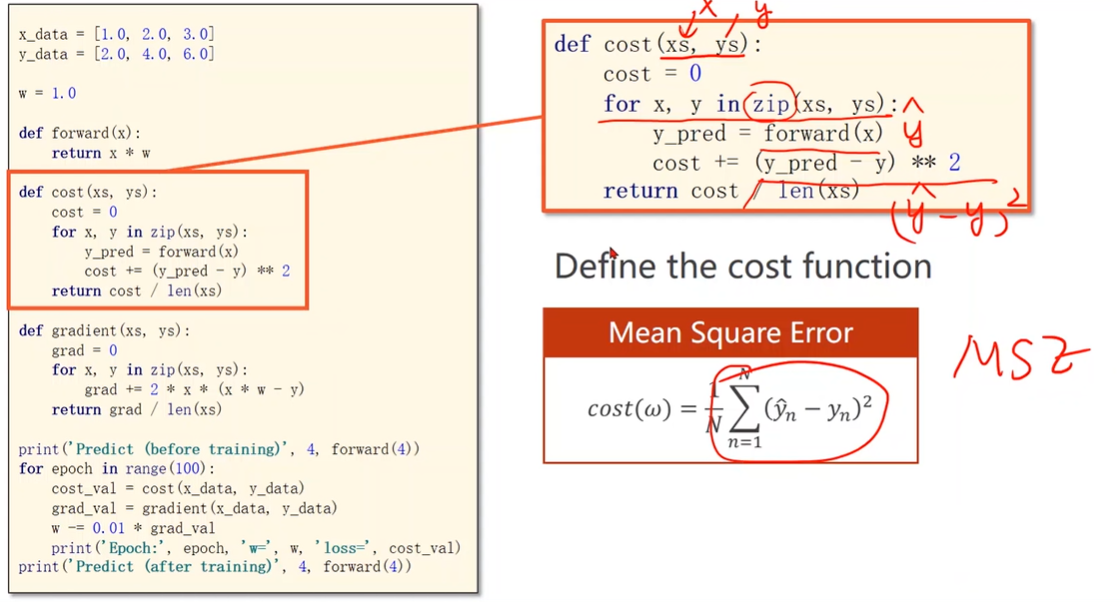
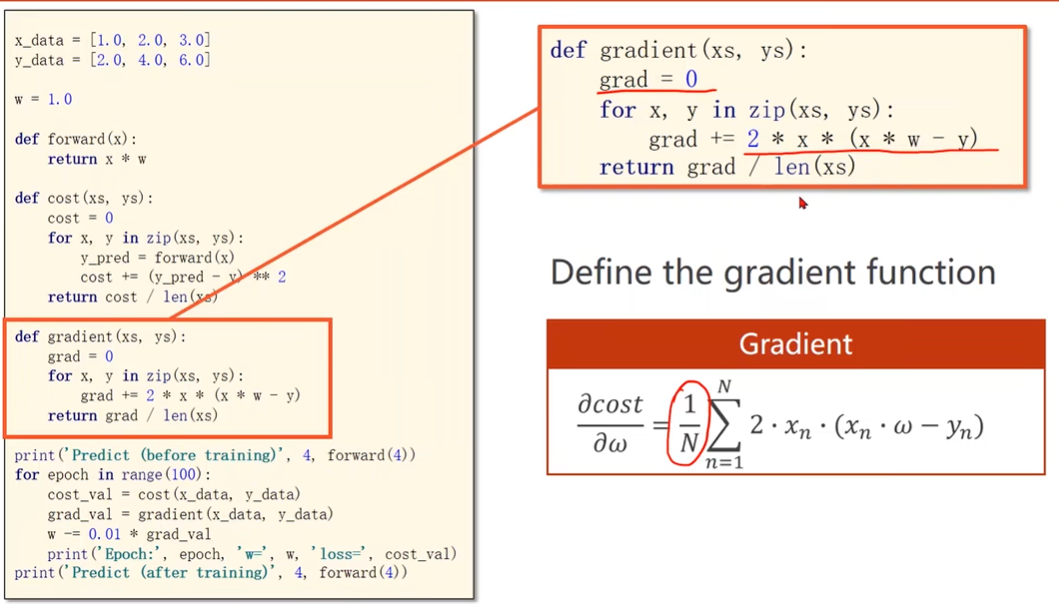
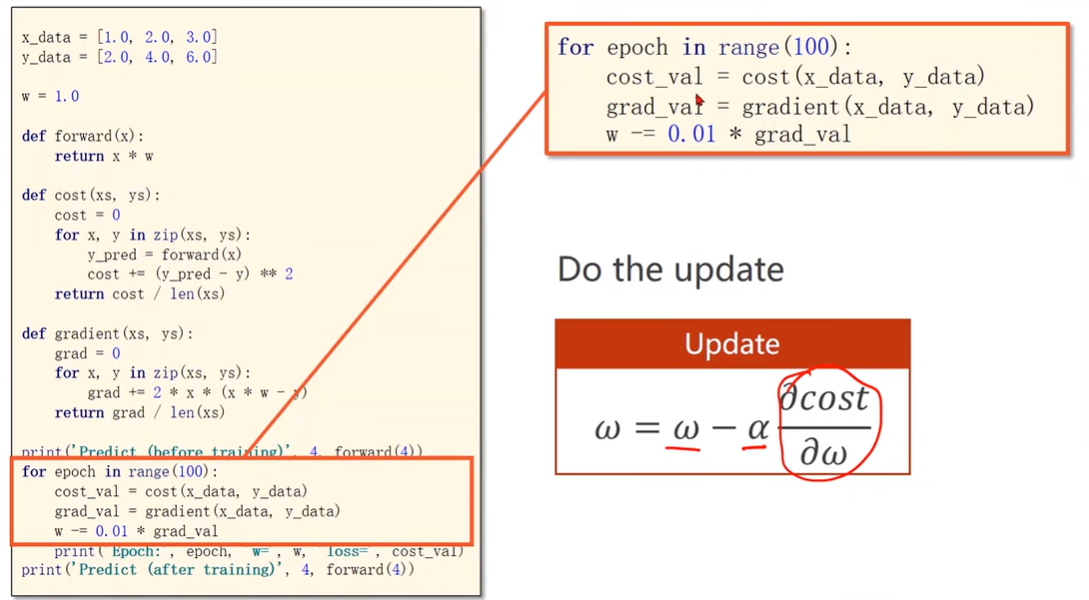
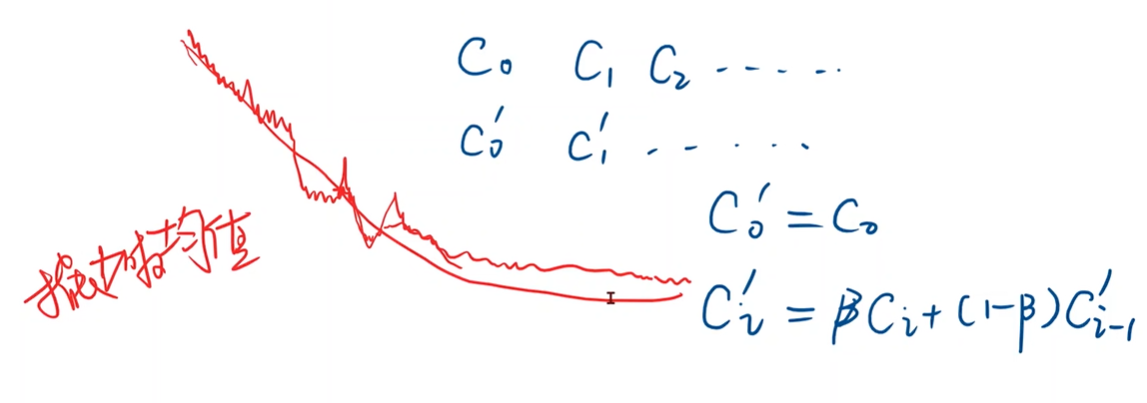
指数加权均值
使函数更平滑
训练发散可能原因
学习率太大
Stochastic Gradient Descent
随机选择一个样本的损失函数对权重求导

使用随机梯度下降原因:
单个样本有随机噪声,能够跨越鞍点

Implementation of SGD

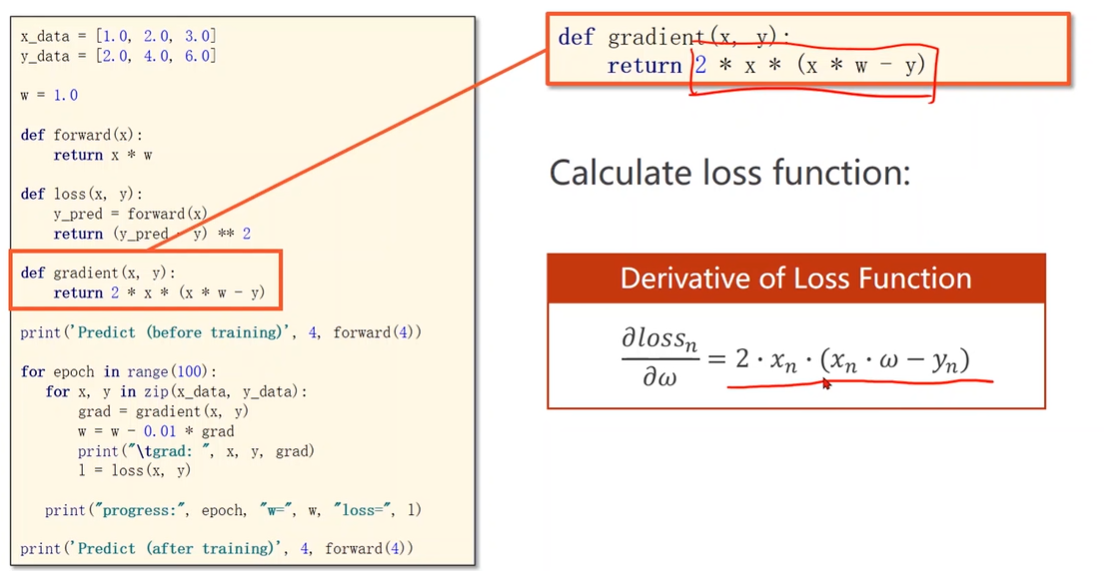
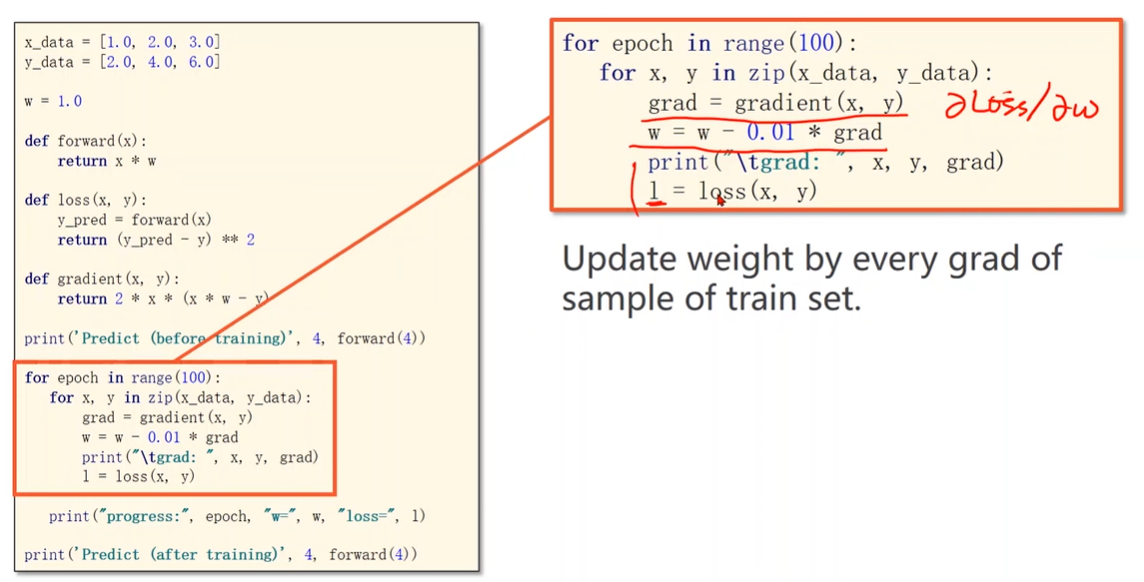
问题
梯度下降可以并行计算,随机梯度下降不能并行,因为下一次的权重更新需要上一个样本更新后的权重。
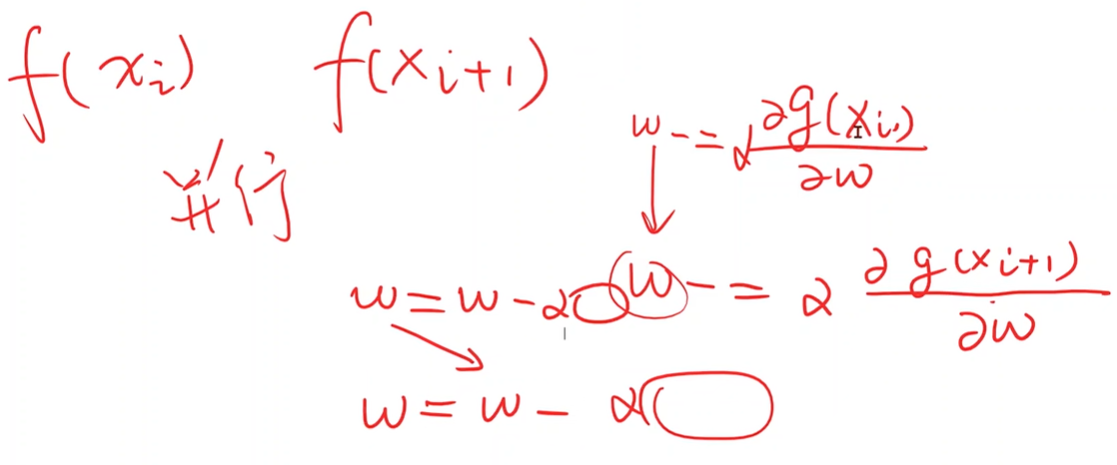
折中方法:Mini-Batch,小批量随机梯度下降算法
每次用一组样本计算梯度然后更新权重

4 Back Propagation
Compute gradient in simple network
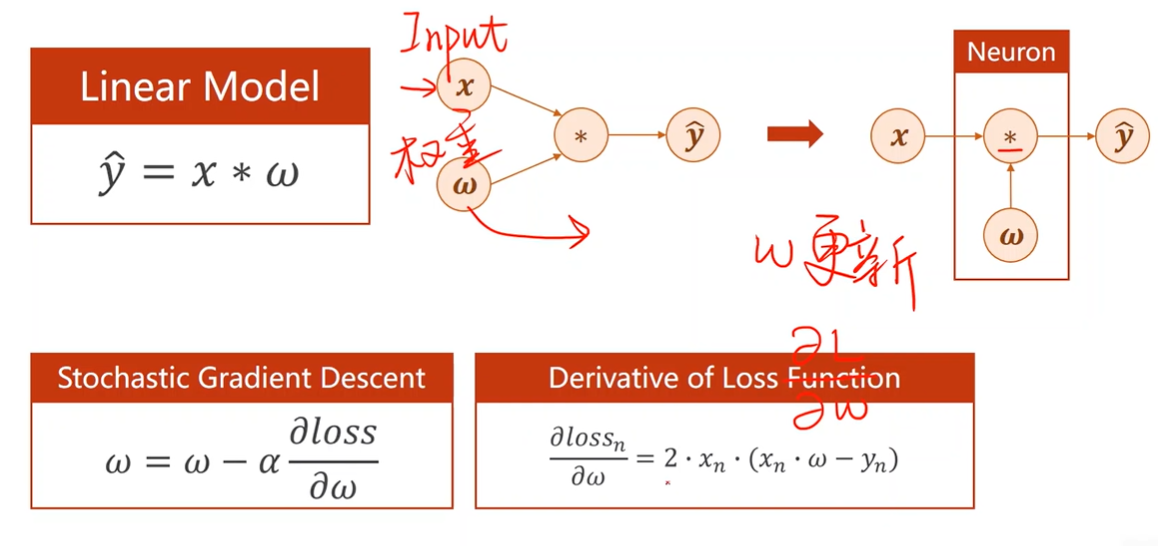
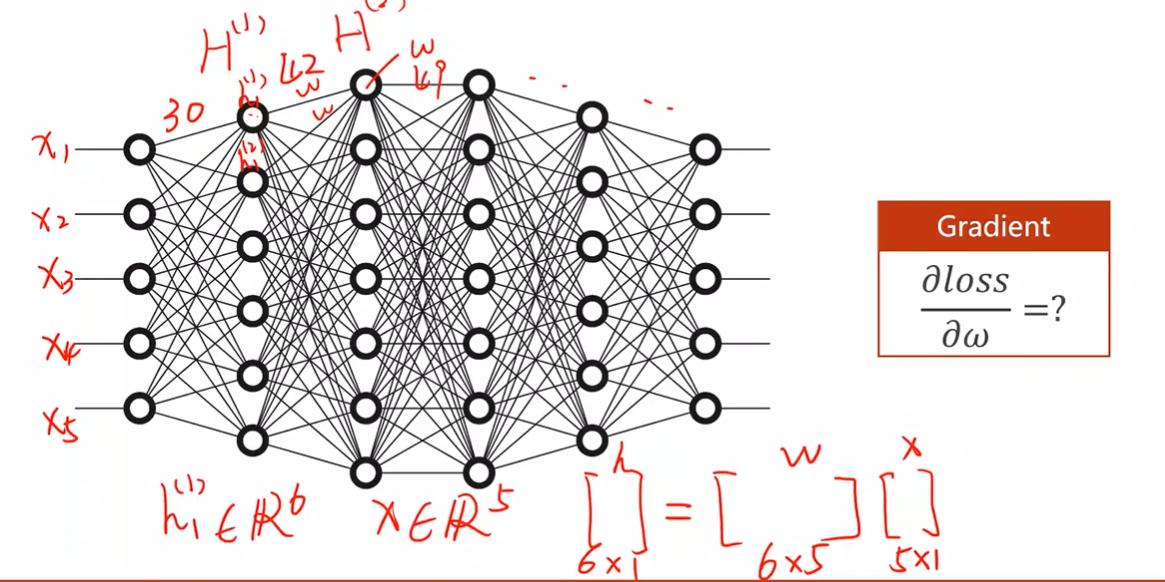
What about the complicated network?
参数很多解析式计算复杂
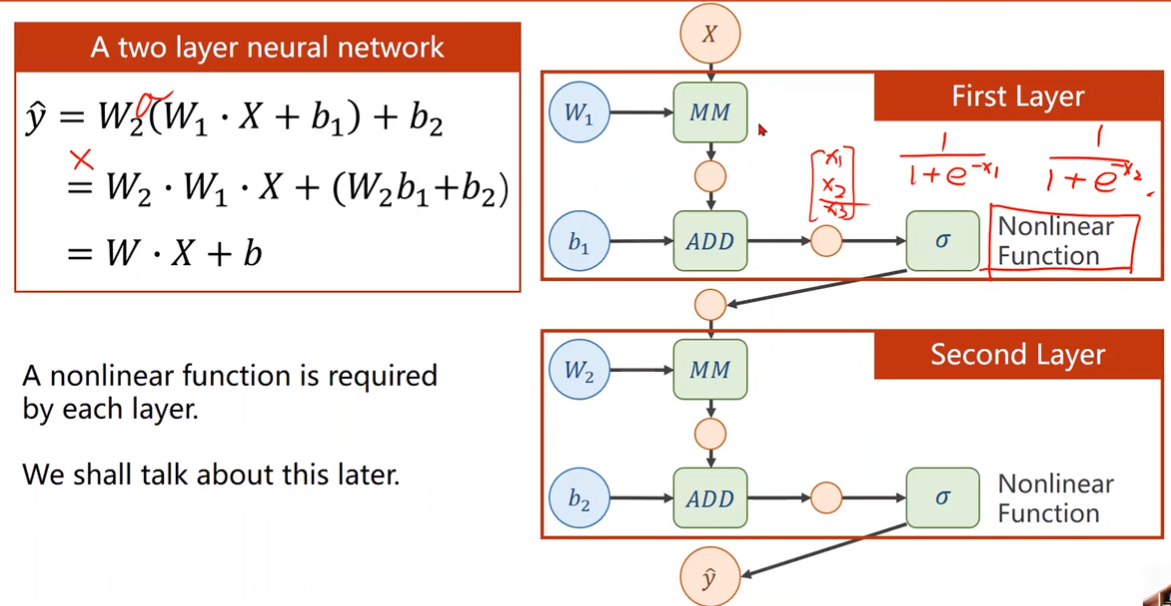
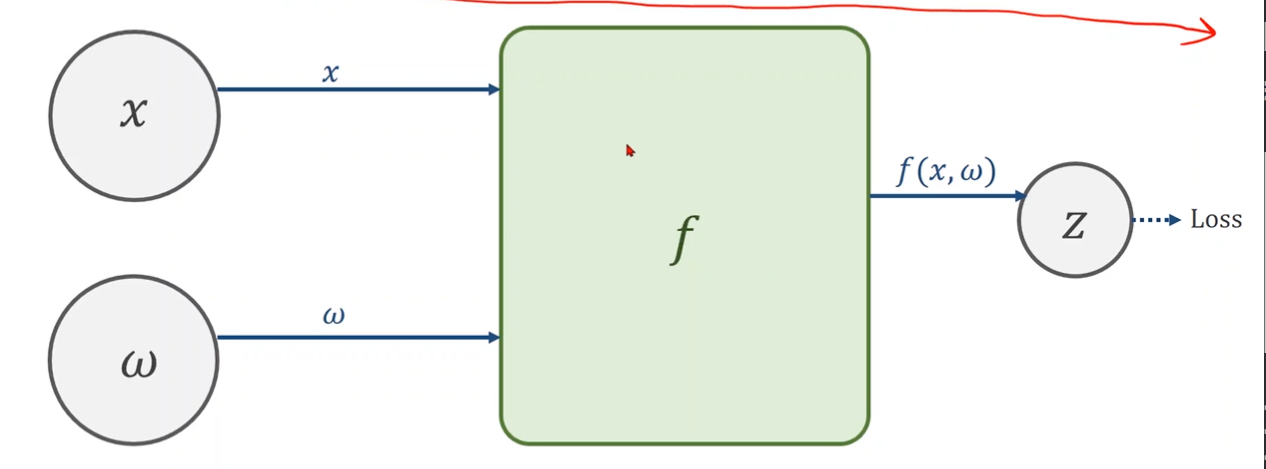
Computational Graph


What problem about two layer neural network?
线性变换会化简,模型复杂度无法提升

添加非线性函数
The composition of functions and Chain Rule
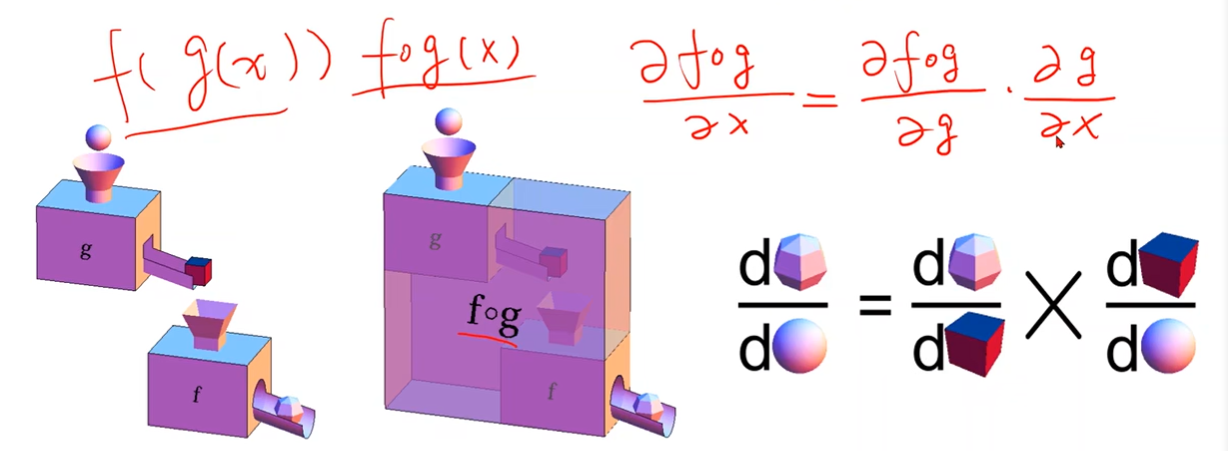
Chain Rule
1.Create Computional Graph(Forward)
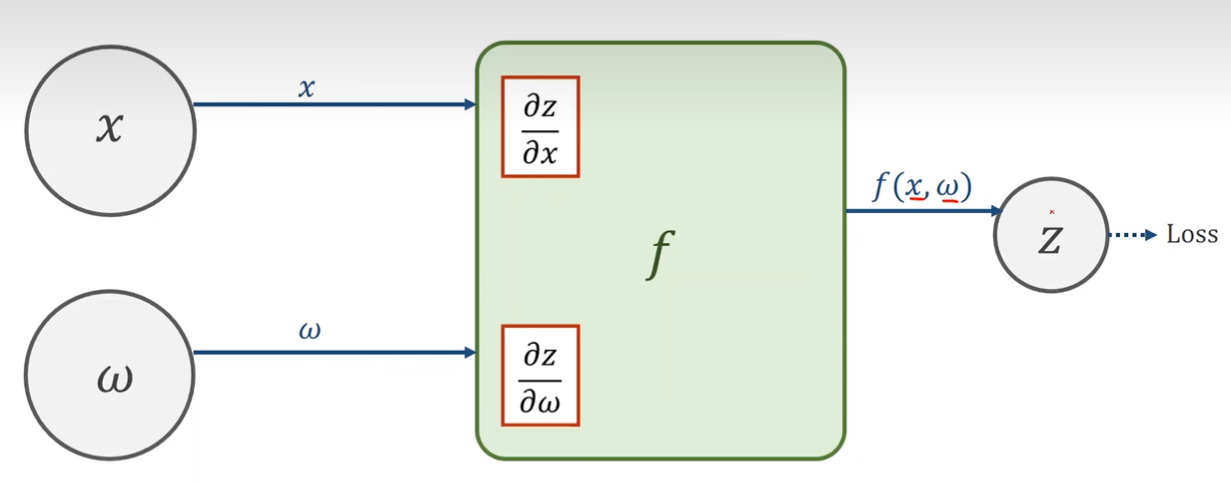
2.Local Gradient 局部梯度
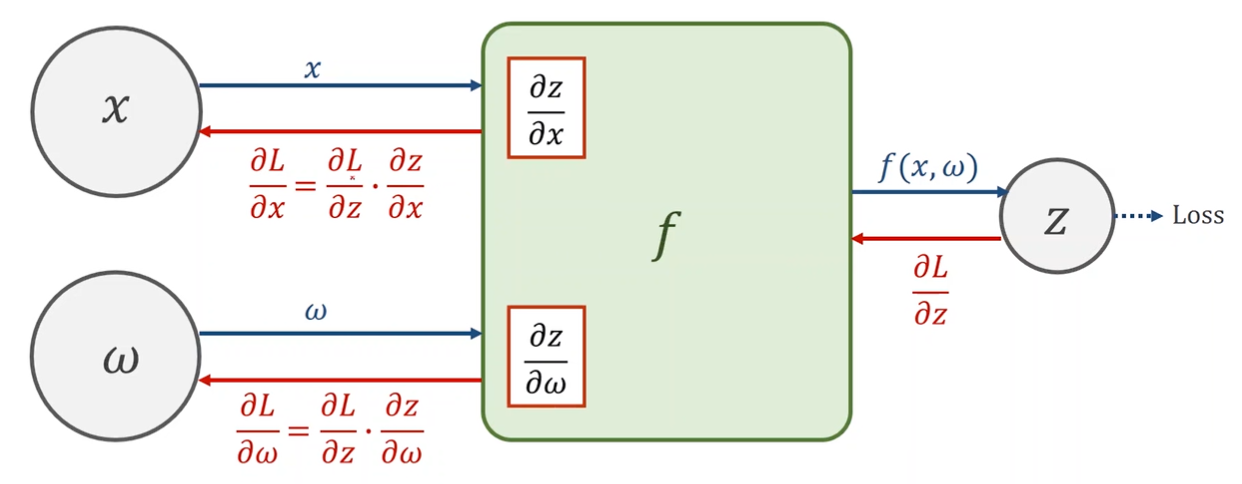
3.Given gradient from succesive node 连续节点

4. Use chain rule to compute the gradient
Examplle
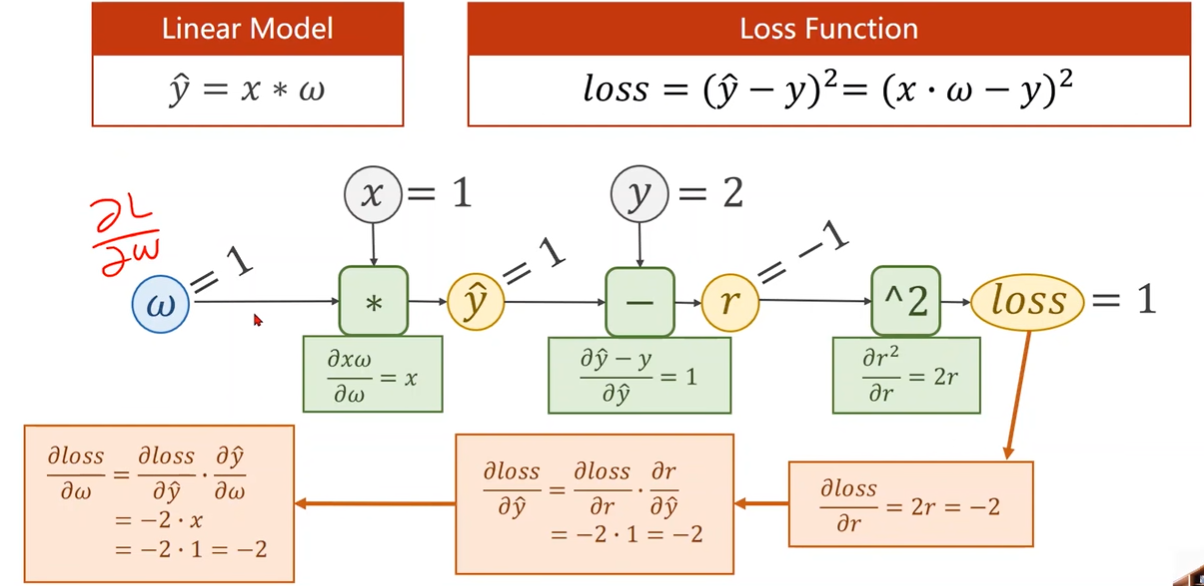
Computational Graph of Linear Model
residual 残差项 r = y_hat - y
有偏置时也要计算b的梯度
Tensor in PyTorch
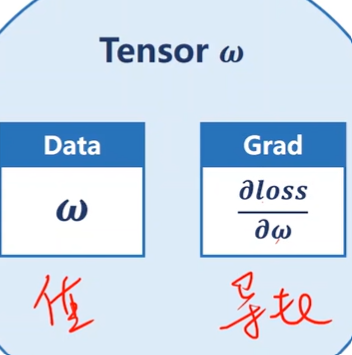
- In PyTorch, Tensor is the important component in constructing dynamic computational graph.
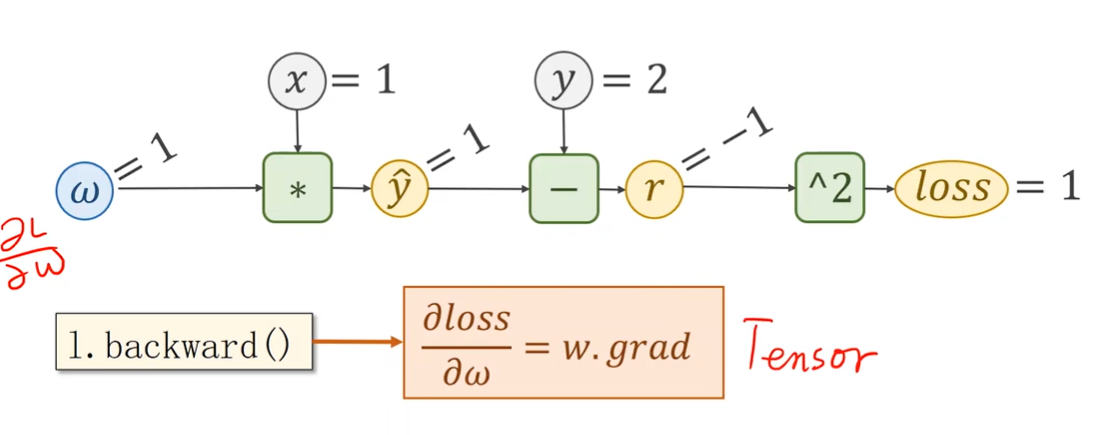
- It contains data and grad,which storage the value of node and gradient w.r.t(with respect to) loss respectively.
Implementation of linear model with PyTorch
1 | |
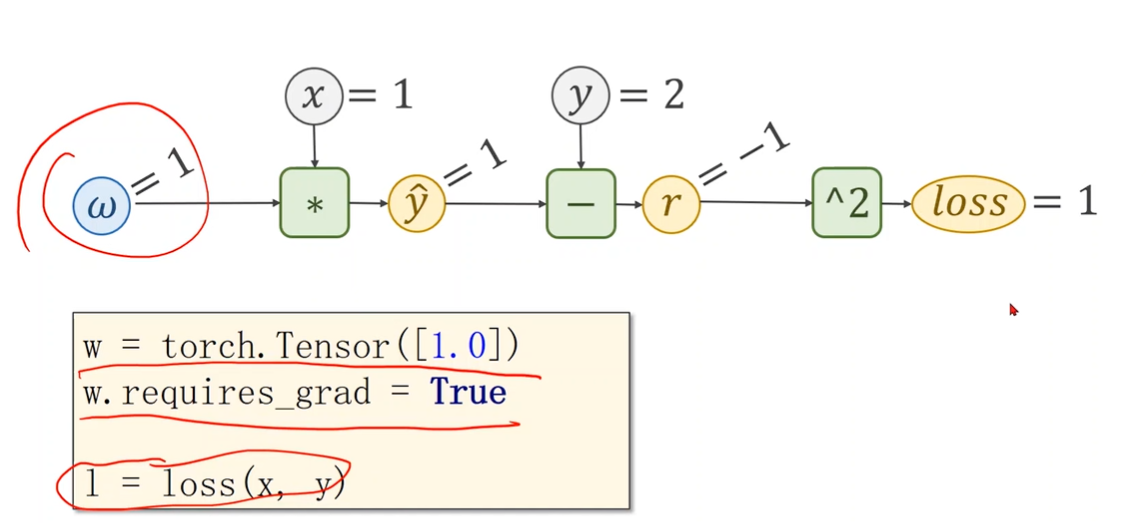
If autograd mechanics are required,the element variable requires_grad of Tensor has to be set to True.
Define the linear model and loss function
1 | |


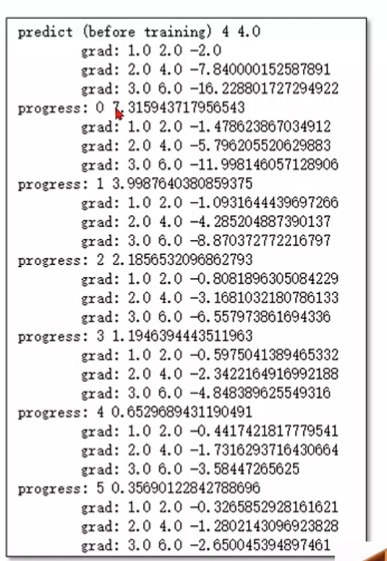
训练过程
1 | |
1 | |
Forward in PyTorch
Backward in PyTorch
Update weight in PyTorch

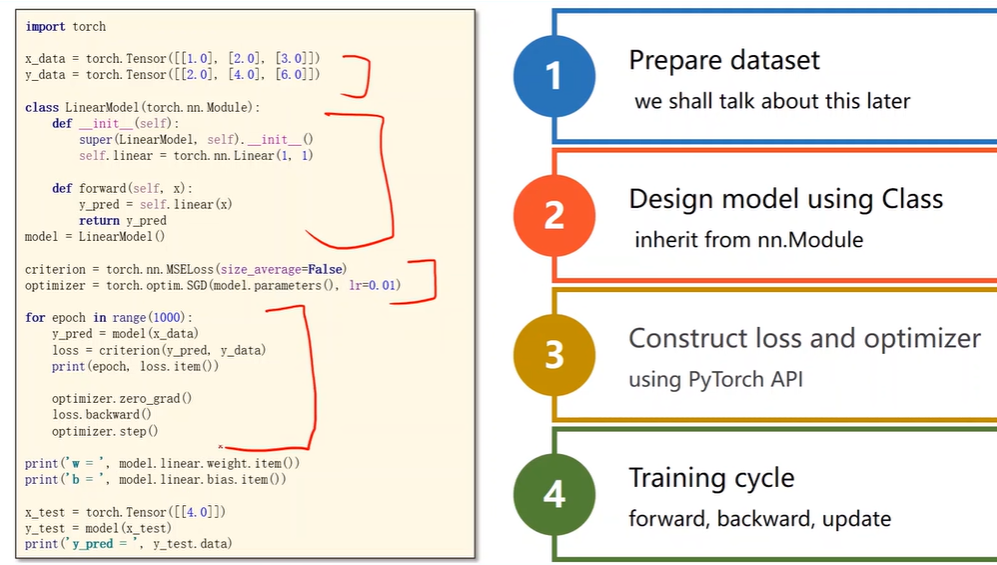
5 Linear Regression with PyTorch
PyTorch Fashion

Prepare dataset

广播机制
矩阵加法时扩充矩阵

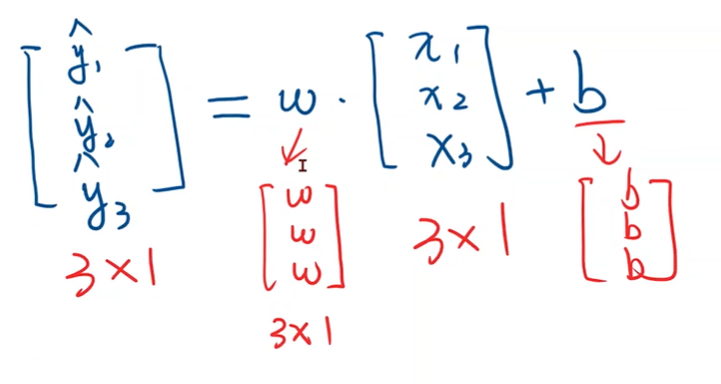
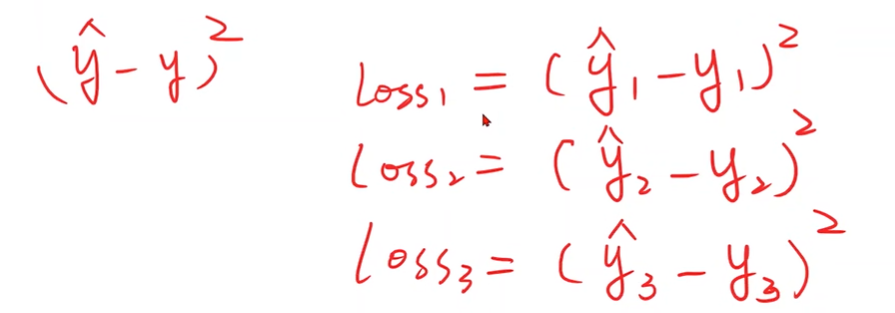


Design model
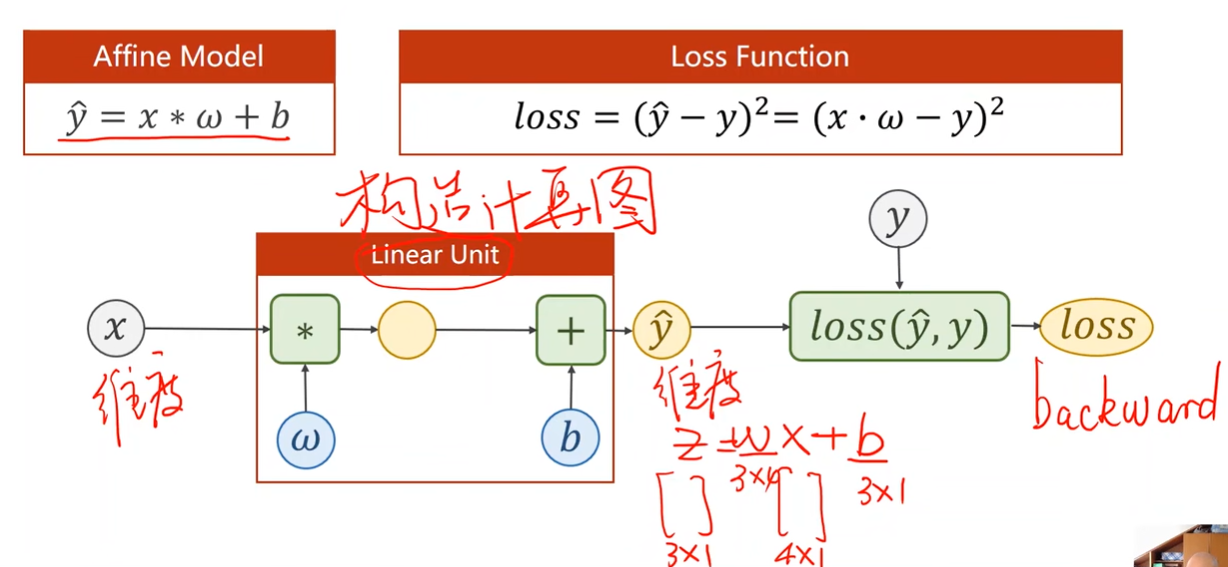
构造计算图
Affine model 仿射模型/线性单元
需要知道x的维度和y的维度,来确定w和b的维度
1 | |
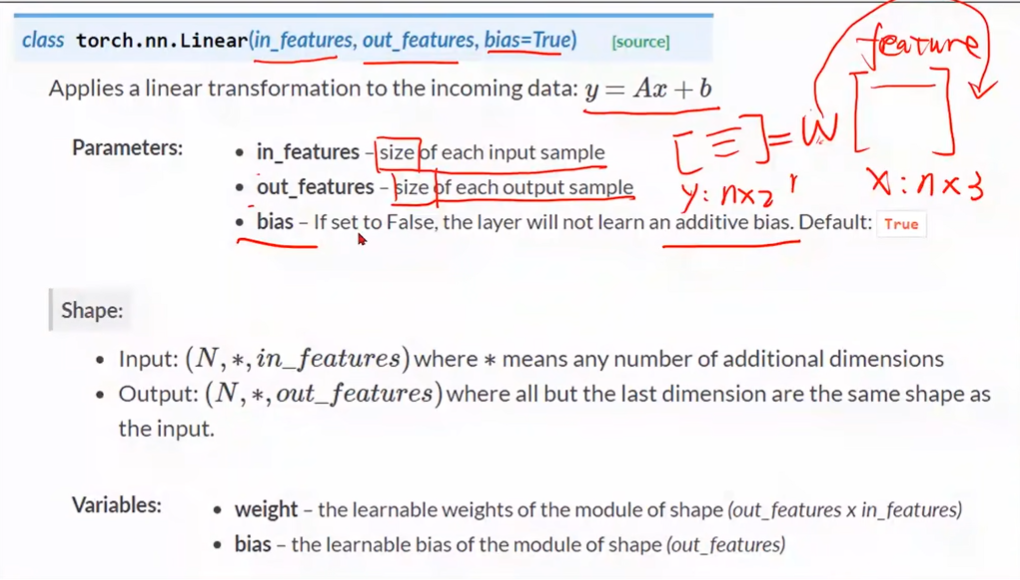
torch.nn.Linear(1, 1)
构造对象,括号内是权重和偏置

行表示样本数,列表示每一个样本的维度
- 二维张量可以表示为 [[1, 2, 3], [4, 5, 6]],其中有两个维度,每个维度包含三个元素。所以该张量的维度是 (2, 3)。
- 样本的维度可以等于样本向量的元素个数。
in_features指输入的维度

可调用对象
1 | |
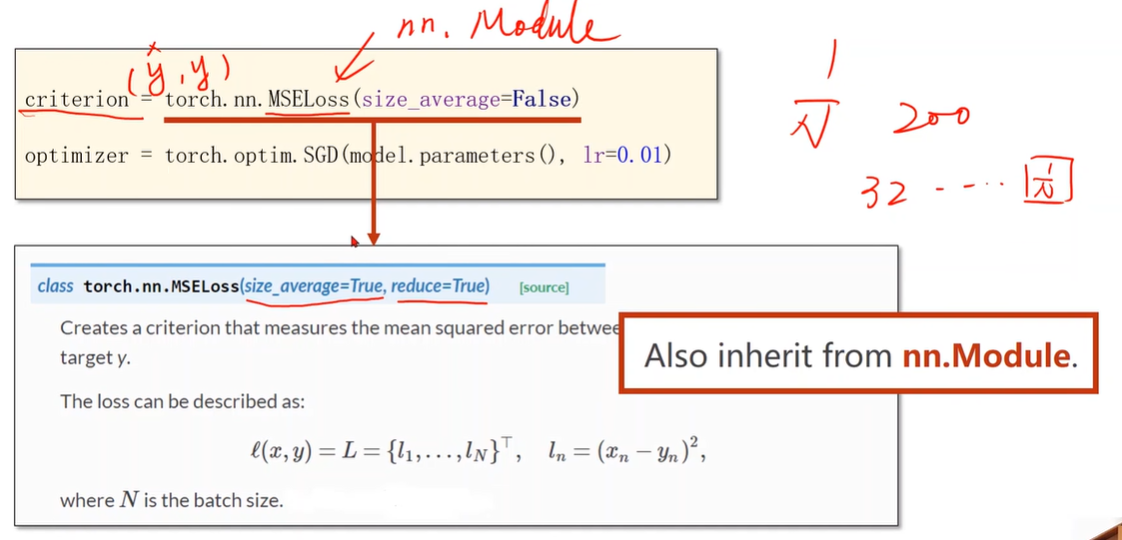
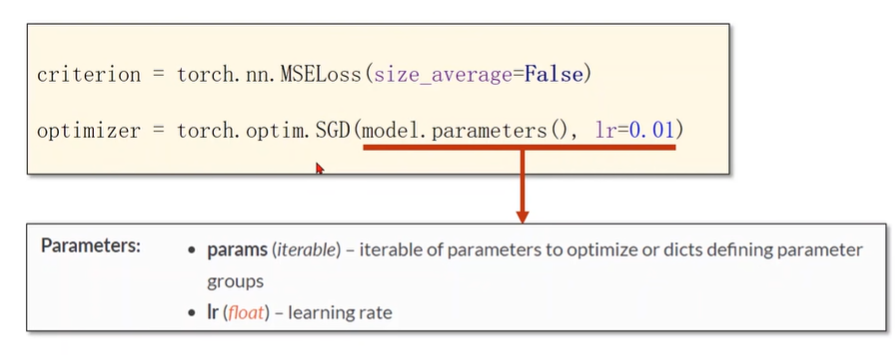
Construct Loss and Optimizer
1 | |

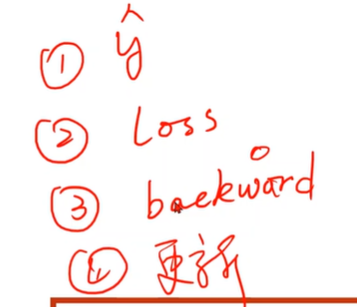
Training Cycle
1 | |
Test Model
1 | |

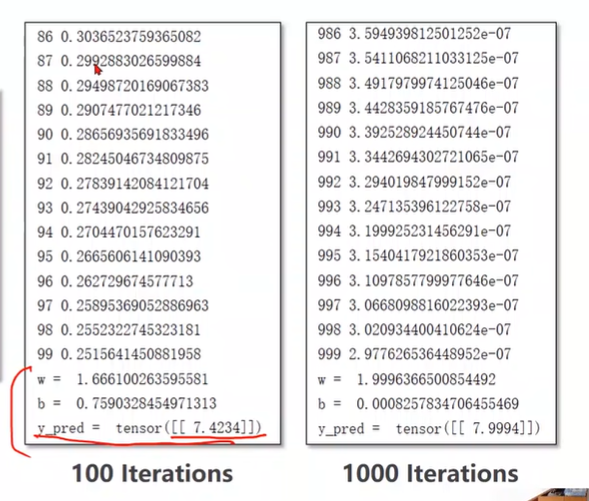
Linear Regression
6 Logistic Regression
Classification - The MNIST Dataset
分裂问题,计算每个类别的概率,找出最大值

1 | |
Classification - The CIFAR-10 dataset

Regression vs Classfication
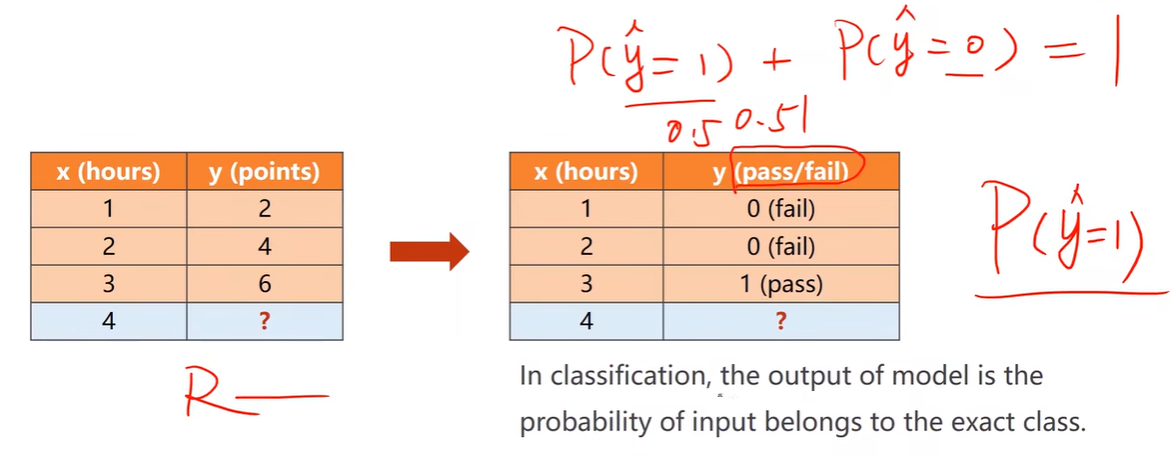
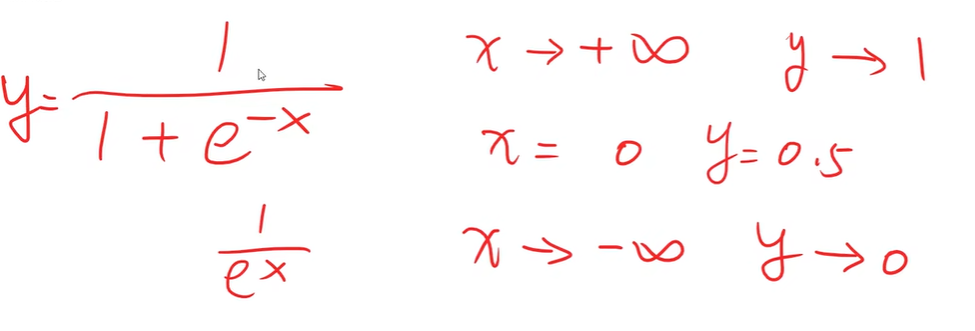
How to map: R ->[0,1 ]
将实数值映射到[0, 1]
Logistic Function
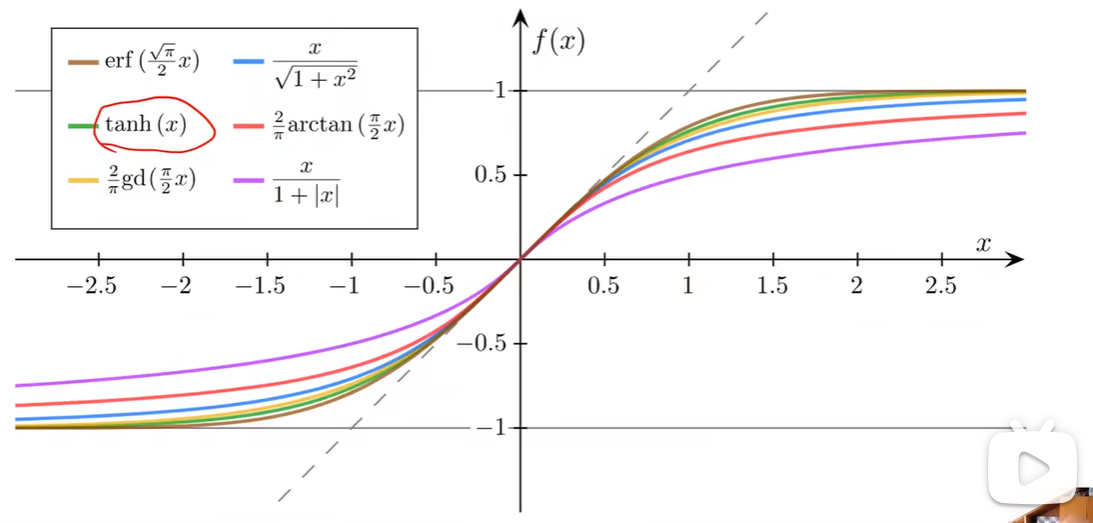
饱和函数:超过某个范围,导数的越来越小
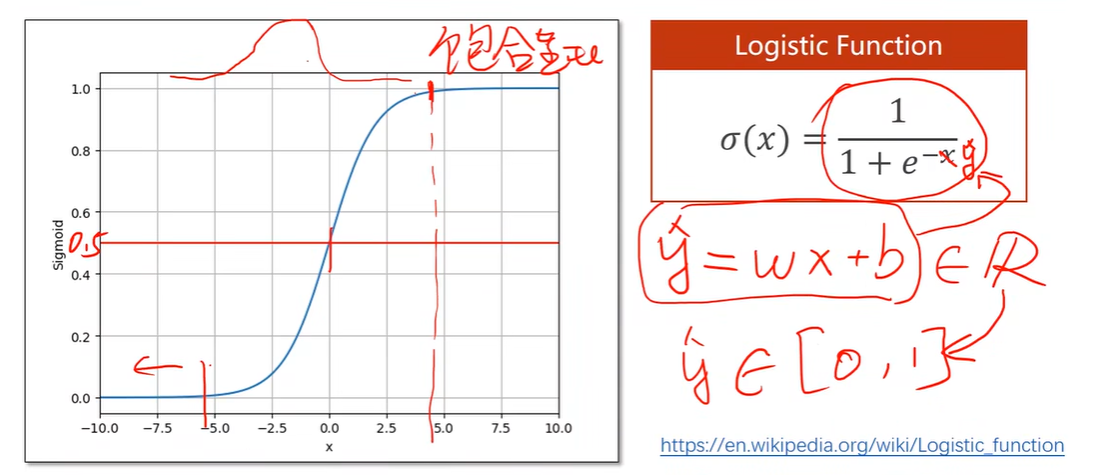
Sigmoid functions
都有极限,单调递增,满足饱和函数
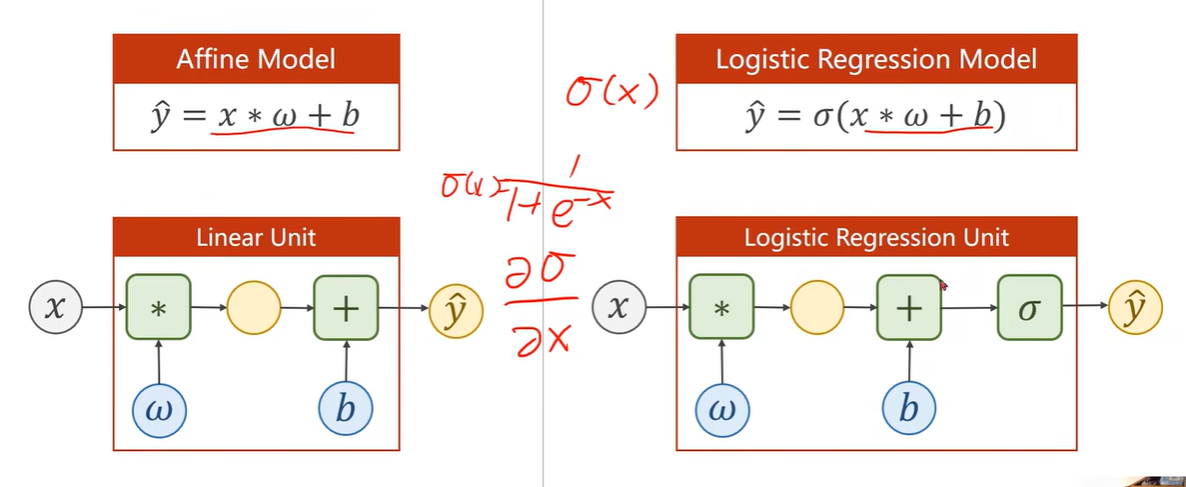
Logistic Regression Model
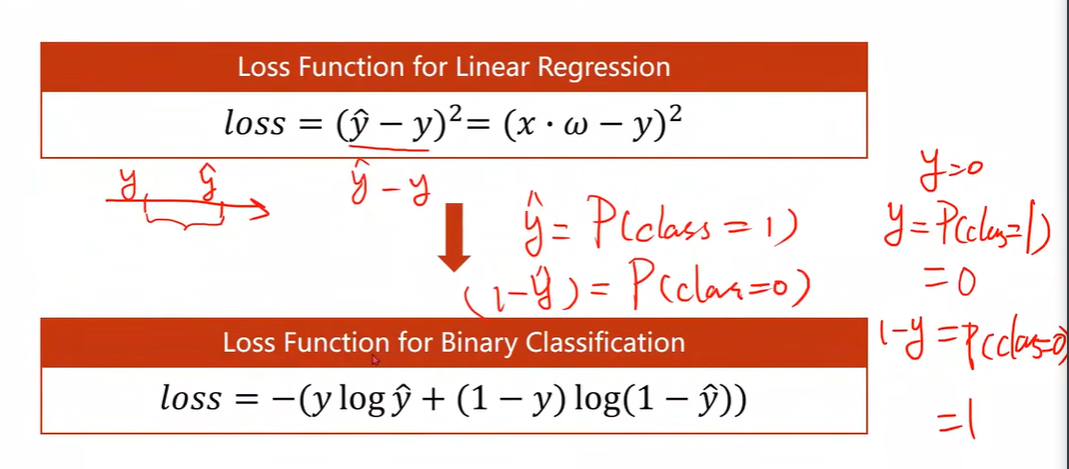
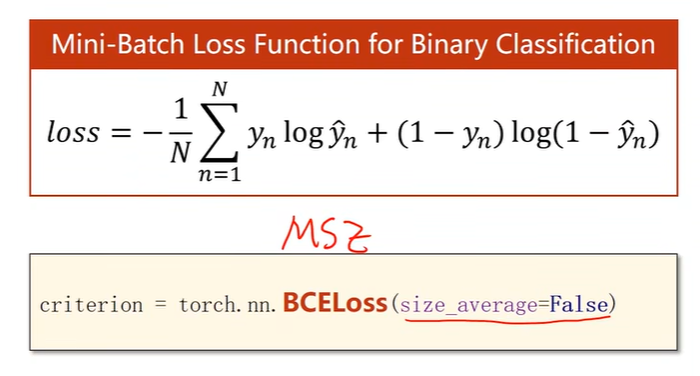
Loss function for Binary Classification
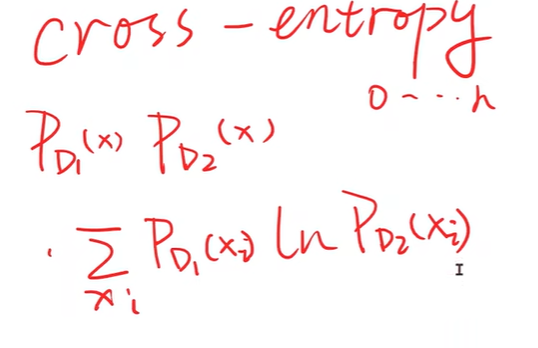
cross-entropy 交叉熵
表示两个分布的差异大小
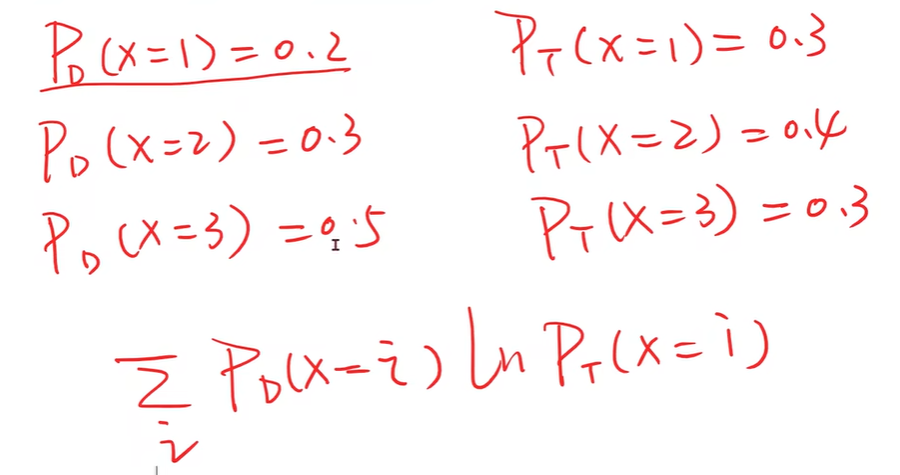
BCE Loss 二分类交叉熵损失函数

Mini-Batch Loss function for Binary Classification

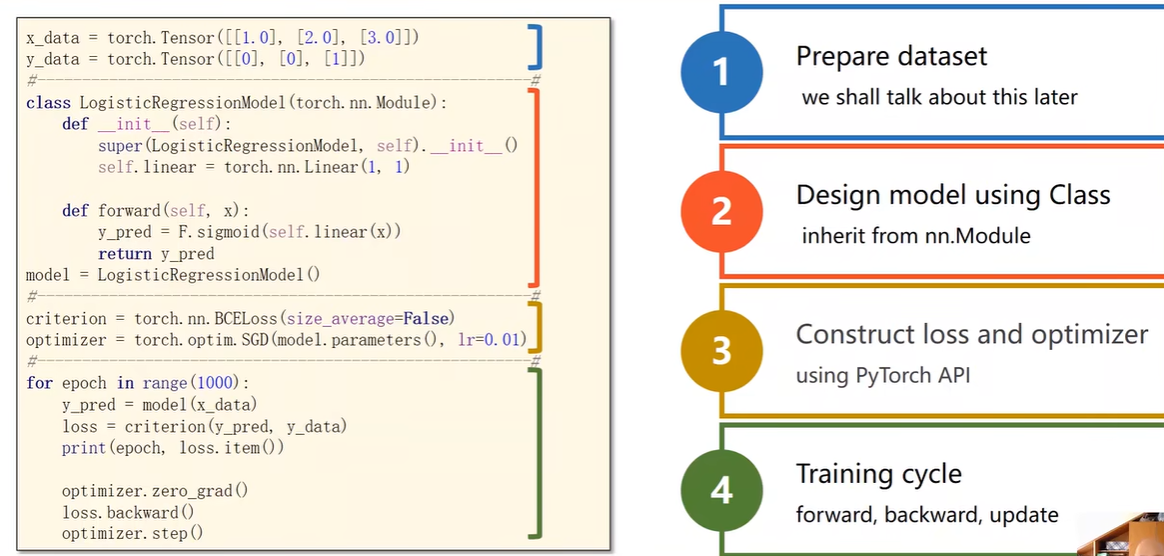
Implementation of Logistic Regression
1 | |
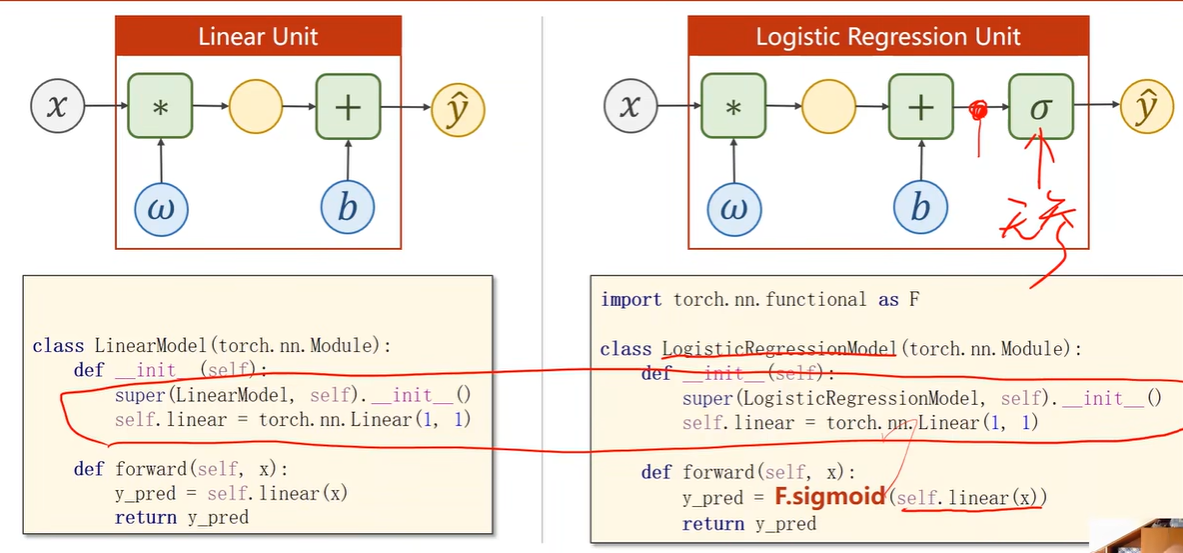
1 | |
总过程
Result of Logistic Regression
1 | |
